Allego SPAC Presentation Deck
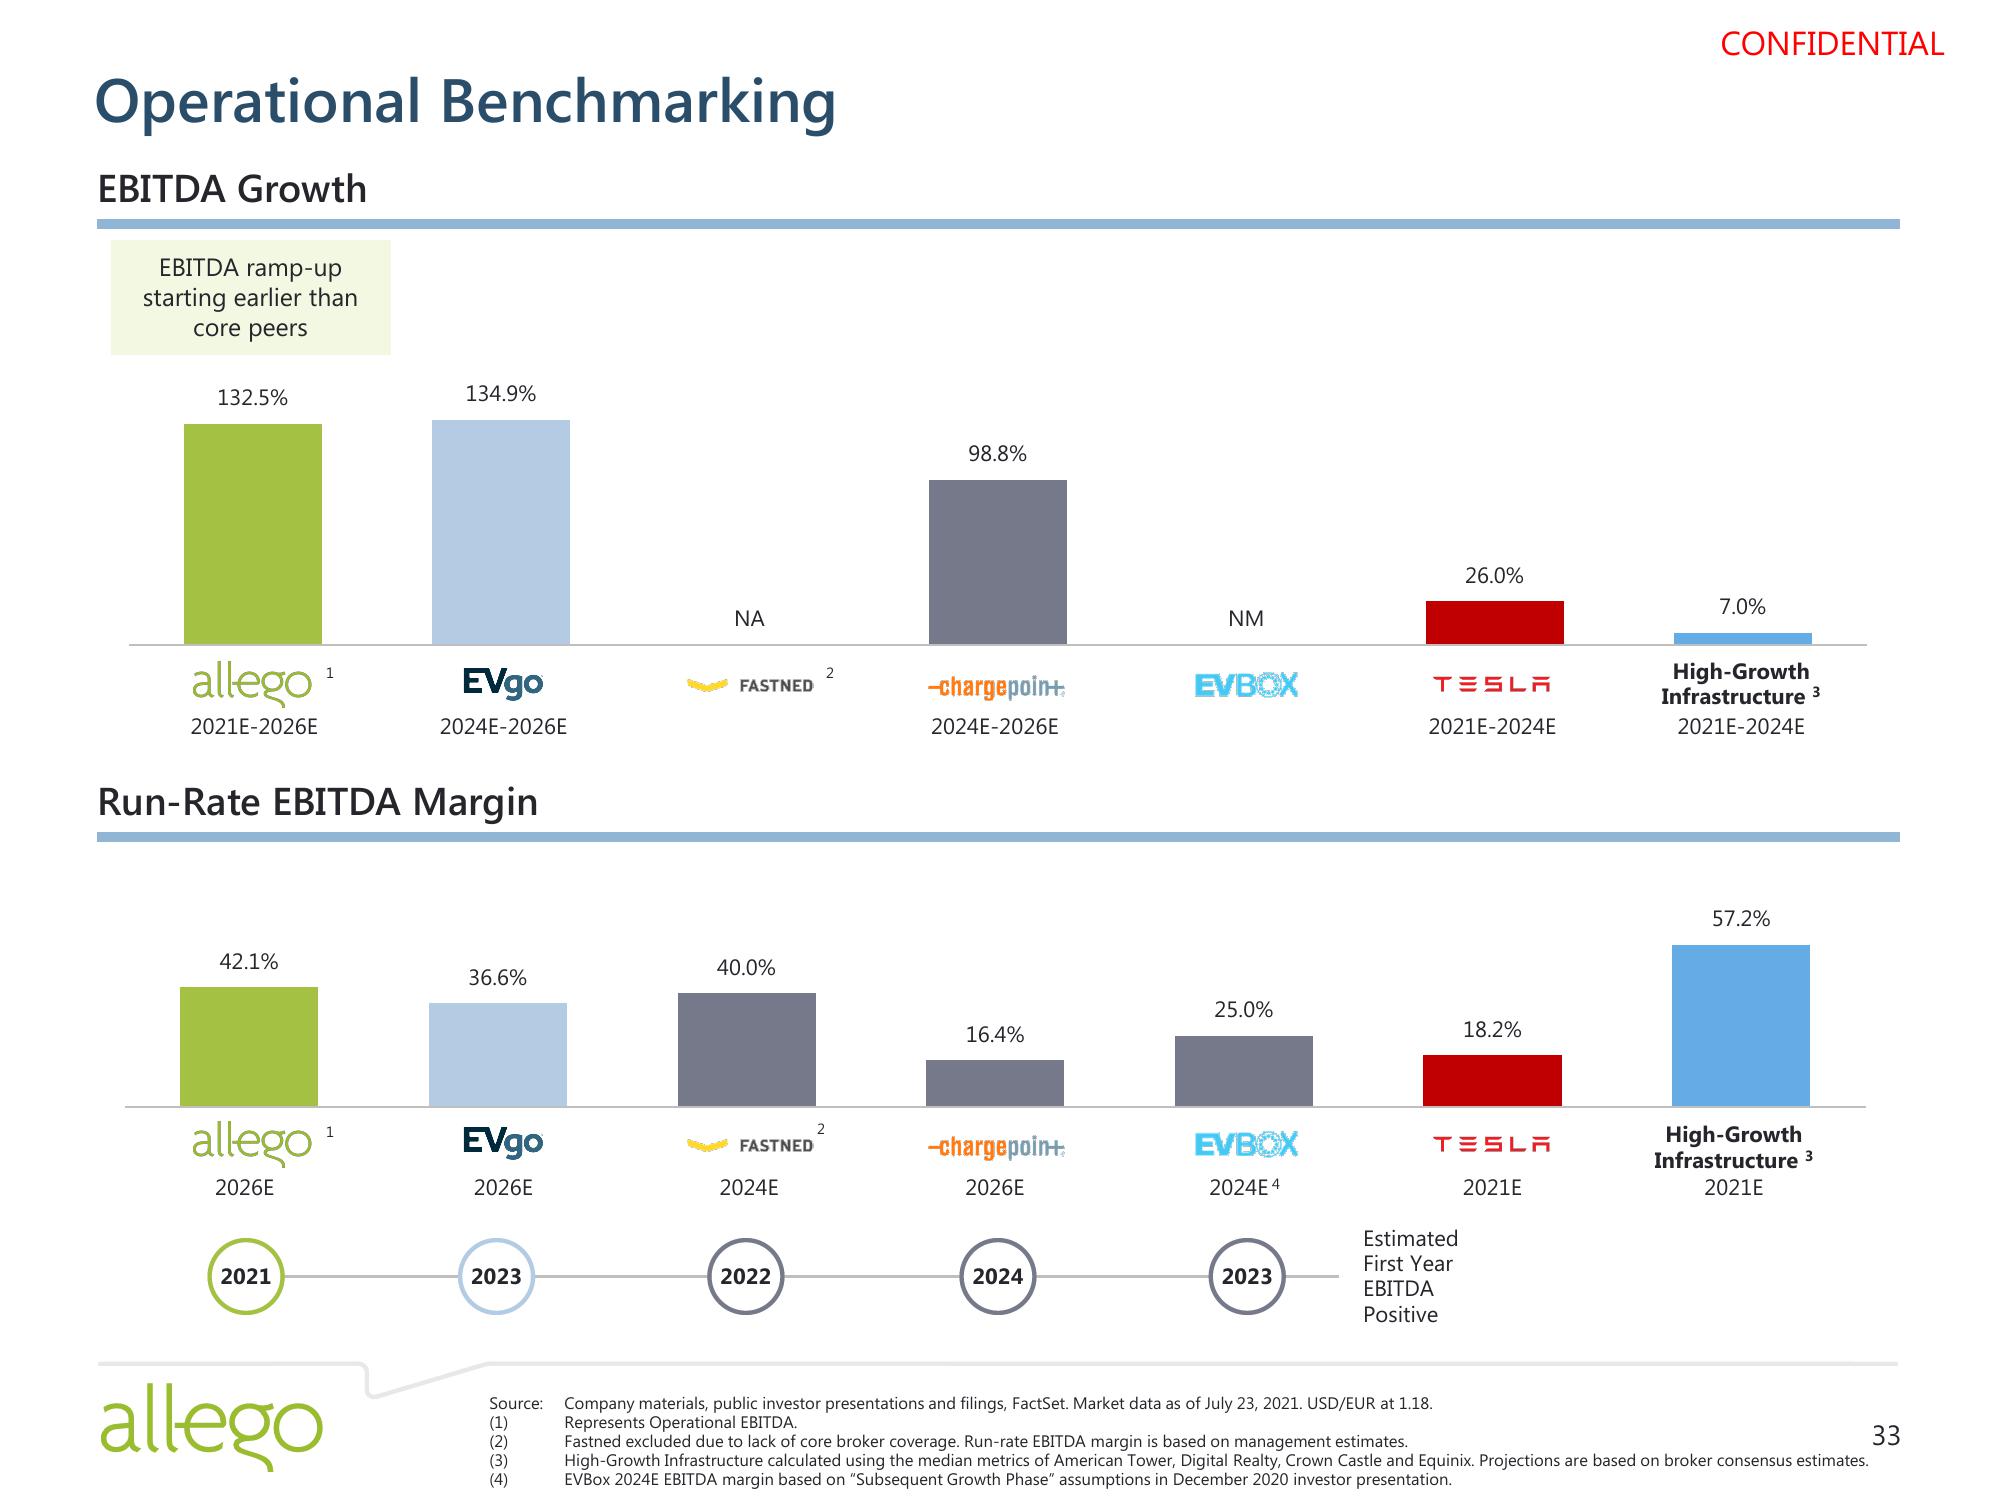
Operational Benchmarking
EBITDA Growth
EBITDA ramp-up
starting earlier than
core peers
132.5%
allego
2021E-2026E
42.1%
allego
2026E
1
Run-Rate EBITDA Margin
2021
1
134.9%
allego
EVgo
2024E-2026E
36.6%
EVgo
2026E
2023
ΝΑ
(1)
(2)
(3)
(4)
FASTNED
40.0%
FASTNED
2024E
2022
2
2
98.8%
-chargepoint
2024E-2026E
16.4%
-chargepoint
2026E
2024
NM
EVBOX
25.0%
EVBOX
2024E4
2023
26.0%
TESLA
2021E-2024E
Estimated
First Year
EBITDA
Positive
18.2%
TESLA
2021E
CONFIDENTIAL
7.0%
High-Growth
Infrastructure 3
2021E-2024E
57.2%
High-Growth
Infrastructure 3
2021E
Source: Company materials, public investor presentations and filings, FactSet. Market data as of July 23, 2021. USD/EUR at 1.18.
Represents Operational EBITDA.
Fastned excluded due to lack of core broker coverage. Run-rate EBITDA margin is based on management estimates.
33
High-Growth Infrastructure calculated using the median metrics of American Tower, Digital Realty, Crown Castle and Equinix. Projections are based on broker consensus estimates.
EVBOX 2024E EBITDA margin based on "Subsequent Growth Phase" assumptions in December 2020 investor presentation.View entire presentation