J.P.Morgan Results Presentation Deck
JPMORGAN CHASE & CO.
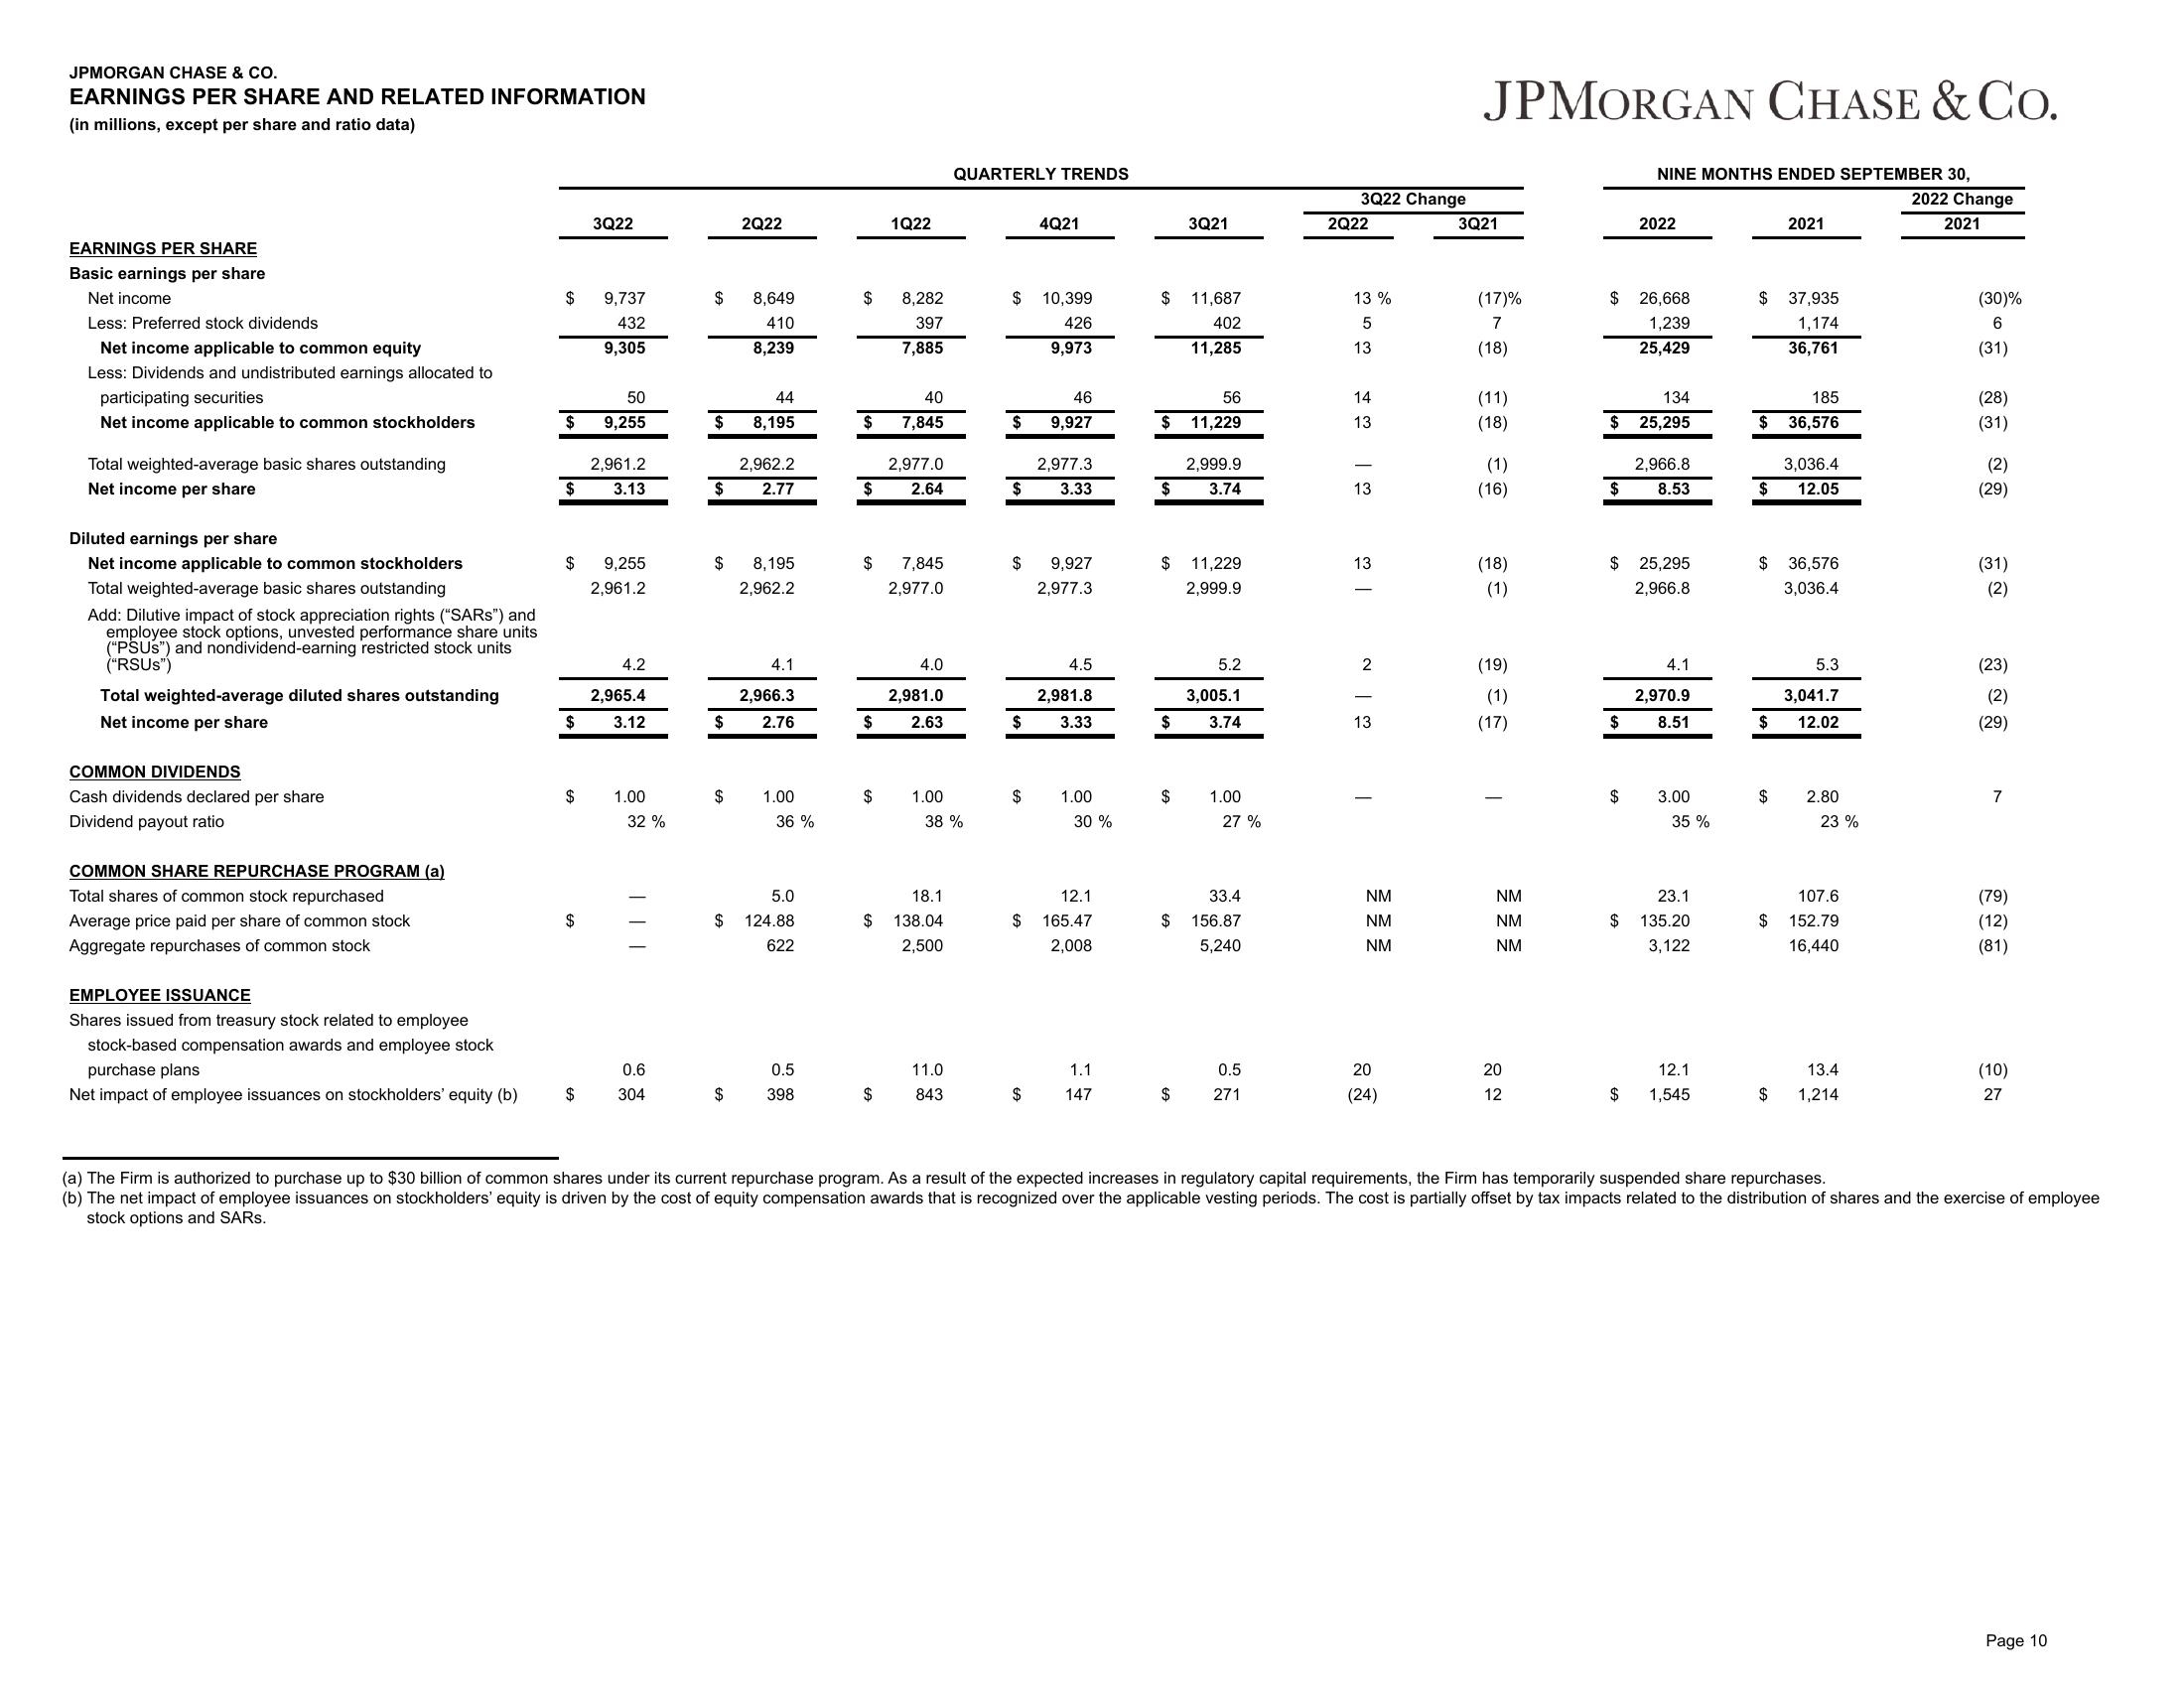
EARNINGS PER SHARE AND RELATED INFORMATION
(in millions, except per share and ratio data)
EARNINGS PER SHARE
Basic earnings per share
Net income
Less: Preferred stock dividends
Net income applicable to common equity
Less: Dividends and undistributed earnings allocated to
participating securities
Net income applicable to common stockholders
Total weighted-average basic shares outstanding
Net income per share
Diluted earnings per share
Net income applicable to common stockholders
Total weighted-average basic shares outstanding
Add: Dilutive impact of stock appreciation rights ("SARS") and
employee stock options, unvested performance share units
("PSUS") and nondividend-earning restricted stock units
("RSUS")
Total weighted-average diluted shares outstanding
Net income per share
COMMON DIVIDENDS
Cash dividends declared per share
Dividend payout ratio
COMMON SHARE REPURCHASE PROGRAM (a)
Total shares of common stock repurchased
Average price paid per share of common stock
Aggregate repurchases of common stock
EMPLOYEE ISSUANCE
Shares issued from treasury stock related to employee
stock-based compensation awards and employee stock
purchase plans
Net impact of employee issuances on stockholders' equity (b)
$
$
$
$
$
$
$
3Q22
9,737
432
9,305
50
9,255
2,961.2
3.13
9,255
2,961.2
4.2
2,965.4
3.12
1.00
32%
| | |
0.6
304
$
$
$
$
2Q22
$ 8,195
2,962.2
GA
8,649
410
8,239
$
44
8,195
2,962.2
2.77
4.1
2,966.3
2.76
1.00
5.0
$ 124.88
622
36%
0.5
398
$ 8,282
397
7,885
$
$
$
1Q22
$
40
7,845
2,977.0
2.64
7,845
2,977.0
4.0
2,981.0
2.63
1.00
38 %
18.1
$ 138.04
2,500
QUARTERLY TRENDS
11.0
843
$ 10,399
426
9,973
46
$ 9,927
$
$
4Q21
$
$
2,977.3
3.33
9,927
2,977.3
4.5
2,981.8
3.33
1.00
30 %
12.1
165.47
2,008
1.1
$ 147
$ 11,687
402
11,285
$
$
2,999.9
$ 3.74
$
3Q21
$
56
11,229
$
11,229
2,999.9
5.2
3,005.1
3.74
1.00
27%
33.4
$ 156.87
5,240
0.5
271
3Q22 Change
2Q22
13 %
5
13
دن
14
13
13
13
2
13
NM
NM
NM
20
(24)
JPMORGAN CHASE & CO.
3Q21
(17)%
7
(18)
(11)
(18)
(1)
(16)
(18)
(1)
(19)
(1)
(17)
I
NM
NM
NM
20
12
NINE MONTHS ENDED SEPTEMBER 30,
$ 26,668
1,239
25,429
2022
134
$ 25,295
$
$
$ 25,295
2,966.8
2,966.8
8.53
4.1
2,970.9
8.51
3.00
35 %
23.1
$ 135.20
3,122
12.1
$ 1,545
$ 37,935
1,174
36,761
2021
185
$36,576
$
$36,576
3,036.4
$
3,036.4
12.05
5.3
3,041.7
12.02
2.80
23%
107.6
152.79
16,440
13.4
$ 1,214
2022 Change
2021
(30)%
6
(31)
(28)
(31)
(2)
(29)
(31)
(2)
(23)
(2)
(29)
7
(79)
(12)
(81)
(10)
27
(a) The Firm is authorized to purchase up to $30 billion of common shares under its current repurchase program. As a result of the expected increases in regulatory capital requirements, the Firm has temporarily suspended share repurchases.
(b) The net impact of employee issuances on stockholders' equity is driven by the cost of equity compensation awards that is recognized over the applicable vesting periods. The cost is partially offset by tax impacts related to the distribution of shares and the exercise of employee
stock options and SARS.
Page 10View entire presentation