Credit Suisse Investment Banking Pitch Book
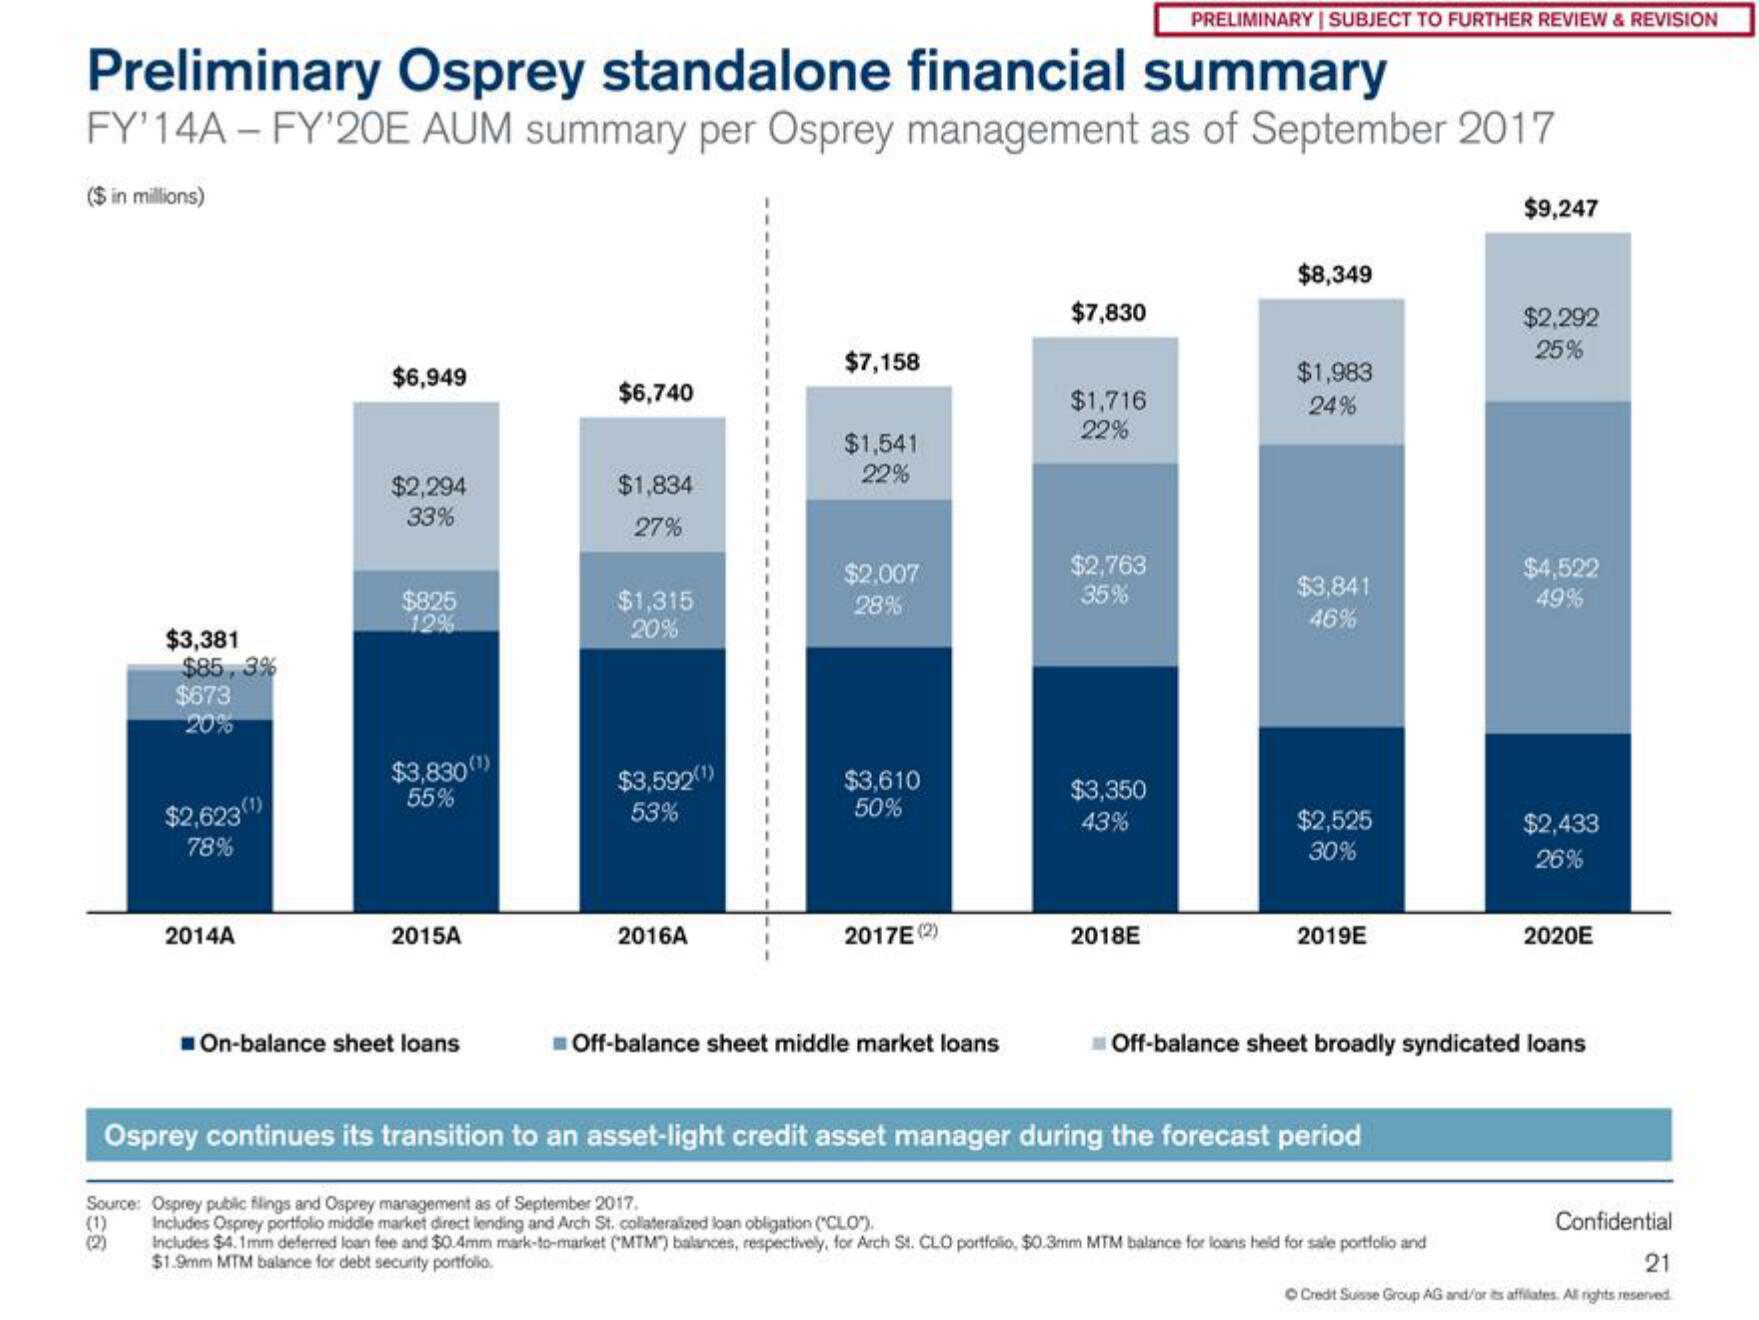
Preliminary Osprey standalone financial summary
FY'14A - FY'20E AUM summary per Osprey management as of September 2017
($ in millions)
$3,381
$85,3%
$673
20%
$2,623(¹)
78%
(1)
(2)
2014A
$6,949
$2,294
33%
$825
12%
$3,830 (¹)
55%
2015A
On-balance sheet loans
$6,740
$1,834
27%
$1,315
20%
$3,592(¹)
53%
2016A
1
1
1
1
$7,158
$1,541
22%
$2,007
28%
$3,610
50%
2017E (2)
Off-balance sheet middle market loans
$7,830
$1,716
22%
$2,763
35%
$3,350
43%
PRELIMINARY | SUBJECT TO FURTHER REVIEW & REVISION
2018E
$8,349
$1,983
24%
$3,841
46%
$2,525
30%
2019E
Osprey continues its transition to an asset-light credit asset manager during the forecast period
Source: Osprey public flings and Osprey management as of September 2017.
Includes Osprey portfolio middle market direct lending and Arch St. collateralized loan obligation ("CLO").
Includes $4.1mm deferred loan fee and $0.4mm mark-to-market (MTM") balances, respectively, for Arch St. CLO portfolio, $0.3mm MTM balance for loans held for sale portfolio and
$1.9mm MTM balance for debt security portfolio.
$9,247
$2,292
25%
$4,522
49%
$2,433
26%
Off-balance sheet broadly syndicated loans
2020E
Confidential
21
Ⓒ Credit Suisse Group AG and/or its affiliates. All rights reserved
OView entire presentation