Asos Results Presentation Deck
© 2023 asos
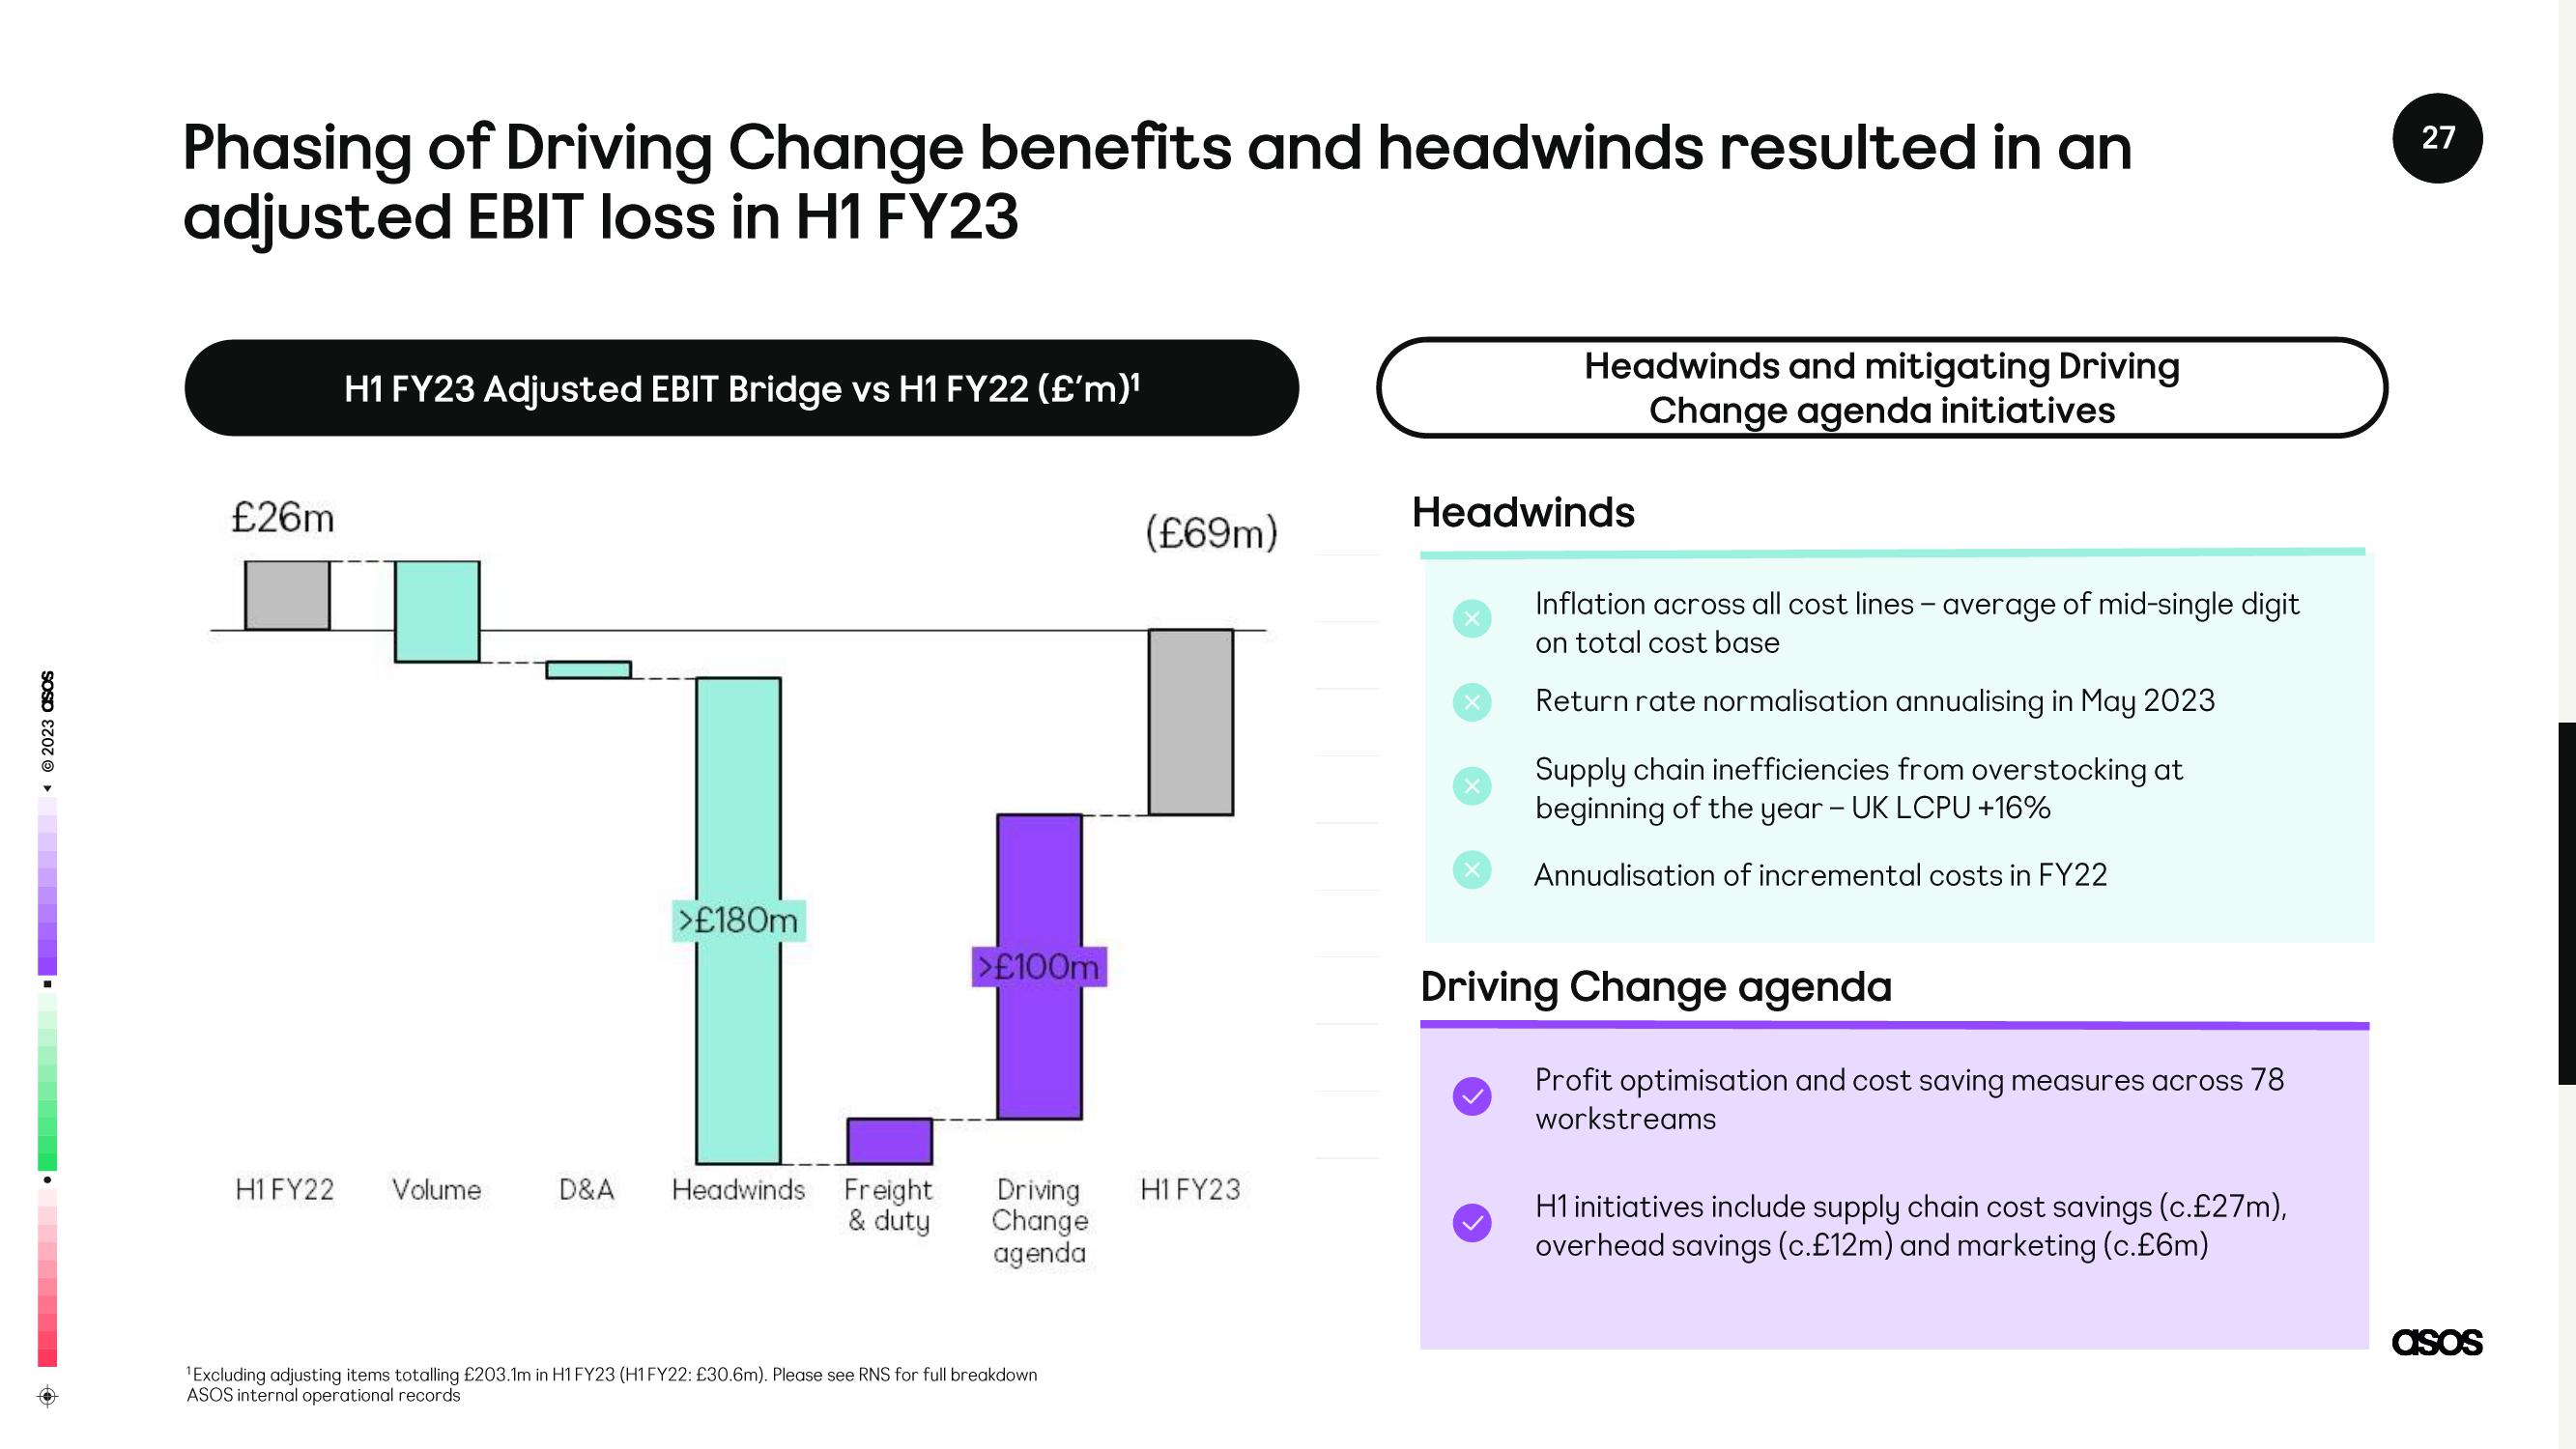
Phasing of Driving Change benefits and headwinds resulted in an
adjusted EBIT loss in H1 FY23
£26m
H1 FY22
H1 FY23 Adjusted EBIT Bridge vs H1 FY22 (£'m)¹
Volume
>£180m
D&A Headwinds
Freight
& duty
>£100m
(£69m)
Driving H1 FY23
Change
agenda
¹Excluding adjusting items totalling £203.1m in H1 FY23 (H1 FY22: £30.6m). Please see RNS for full breakdown
ASOS internal operational records
Headwinds
X
Headwinds and mitigating Driving
Change agenda initiatives
X
Inflation across all cost lines - average of mid-single digit
on total cost base
Return rate normalisation annualising in May 2023
Supply chain inefficiencies from overstocking at
beginning of the year - UK LCPU +16%
Annualisation of incremental costs in FY22
Driving Change agenda
Profit optimisation and cost saving measures across 78
workstreams
H1 initiatives include supply chain cost savings (c.£27m),
overhead savings (c.£12m) and marketing (c.£6m)
27
asosView entire presentation