Summer 2023 Solar Industry Update
6
8
<<
7
Quarterly PV Installed (GWdc)
L
0
+
3
л
6
U.S. Installation Breakdown
Annual: SEIA (GWdc)
Unlike the previous slide, these values are in GW dc-not GW₂
ac'
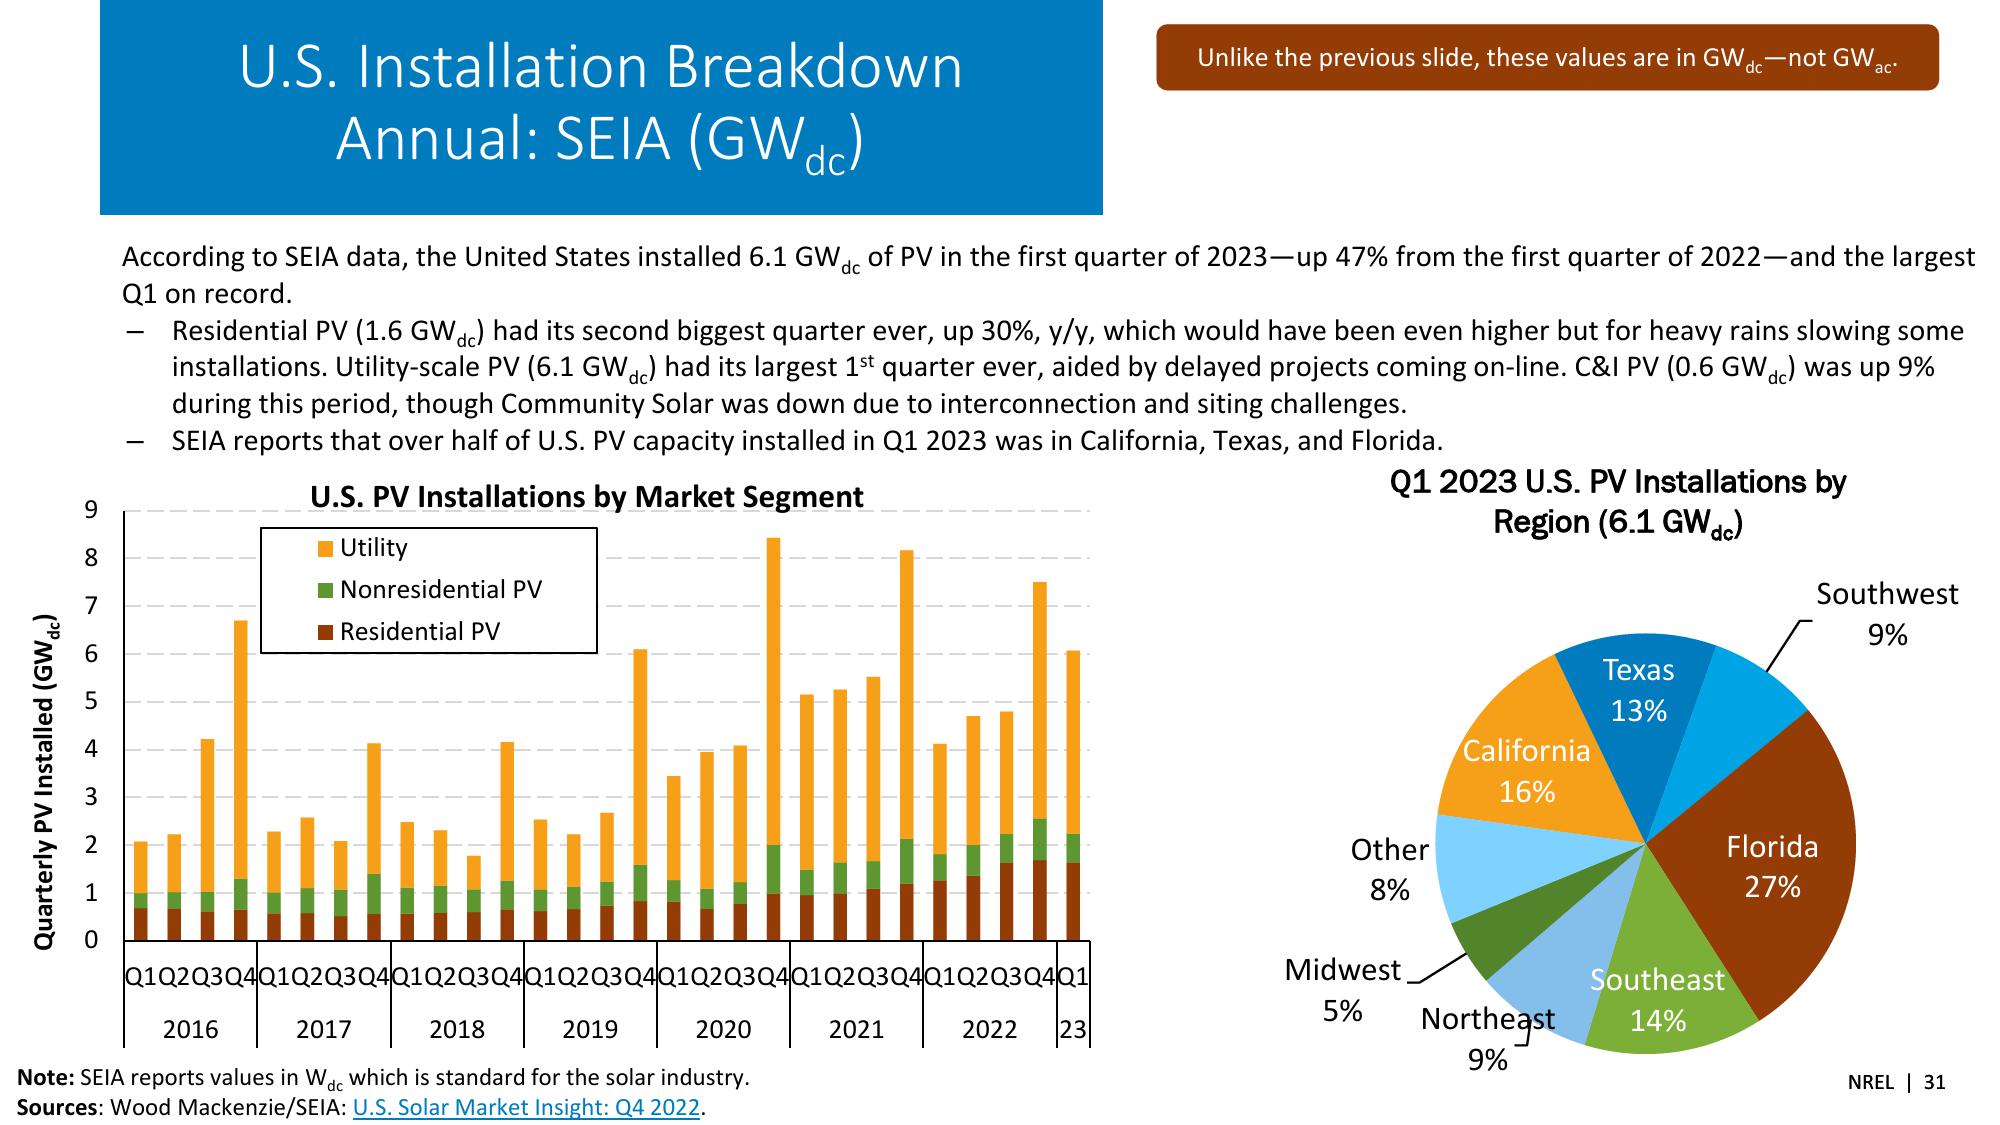
According to SEIA data, the United States installed 6.1 GW dc of PV in the first quarter of 2023-up 47% from the first quarter of 2022-and the largest
Q1 on record.
Residential PV (1.6 GWdc) had its second biggest quarter ever, up 30%, y/y, which would have been even higher but for heavy rains slowing some
installations. Utility-scale PV (6.1 GW dc) had its largest 1st quarter ever, aided by delayed projects coming on-line. C&I PV (0.6 GW dc) was up 9%
during this period, though Community Solar was down due to interconnection and siting challenges.
SEIA reports that over half of U.S. PV capacity installed in Q1 2023 was in California, Texas, and Florida.
U.S. PV Installations by Market Segment
Q1 2023 U.S. PV Installations by
Region (6.1 GWdc)
■Utility
Nonresidential PV
Residential PV
Q1Q2 Q3 Q4Q1Q2 Q3 Q4Q1Q2 Q3 Q4Q1Q2 Q3 Q4Q1Q2 Q3 Q4Q1Q2 Q3 Q4Q1Q2 Q3 Q4Q1
2016
2017
2018
2019
2020
Note: SEIA reports values in Wdc which is standard for the solar industry.
Sources: Wood Mackenzie/SEIA: U.S. Solar Market Insight: Q4 2022.
2021
Other
8%
Southwest
9%
Texas
13%
California
16%
Midwest
5%
2022
||23|
Northeast
Southeast
14%
9%
Florida
27%
NREL 31View entire presentation