Deutsche Bank Results Presentation Deck
Investment Bank
In € m, unless stated otherwise
Financial results
Statement of income
Revenues
Revenues ex-specific items¹
Provision for credit losses
Noninterest expenses
Adjusted costs
Pre-provision profit
Profit (loss) before tax
Balance sheet and resources
Loans, € bn²
Deposits, € bn
Leverage exposure, € bn
Risk-weighted assets, € bn
Provision for credit losses, bps of
average loans³
Performance measures and ratios
Cost/income ratio
ROTE4
Q1 2023
Note: for footnotes refer to slides 45 and 46
Deutsche Bank
Investor Relations
2,691 (19)%
2,644
(21)%
41
1,792
1,759
900
861
103
11
541
142
16
A vs.
A vs.
Q1 2022 Q4 2022
67%
8.5%
61%
54%
14% (48)%
(0)%
12%
(2)%
14%
(41)%
(42)%
n.m.
n.m.
10%
(0)%
(20)% (35)%
(1)%
(2)%
1bps (14)bps
2%
2%
13ppt (29)ppt
(8.1)ppt 9.8ppt
Q1 2023 results
April 27, 2023
Revenue performance
FIC Sales
& Trading
Origination
& Advisory
Other
Investment
Bank
327
2,360
A vs. Q1
2022
XX% Excluding specific items¹
(17) % (17) %
(31) % (31) %
(47)%
n.m.
2,691 (19) % (21)%
Key highlights
/
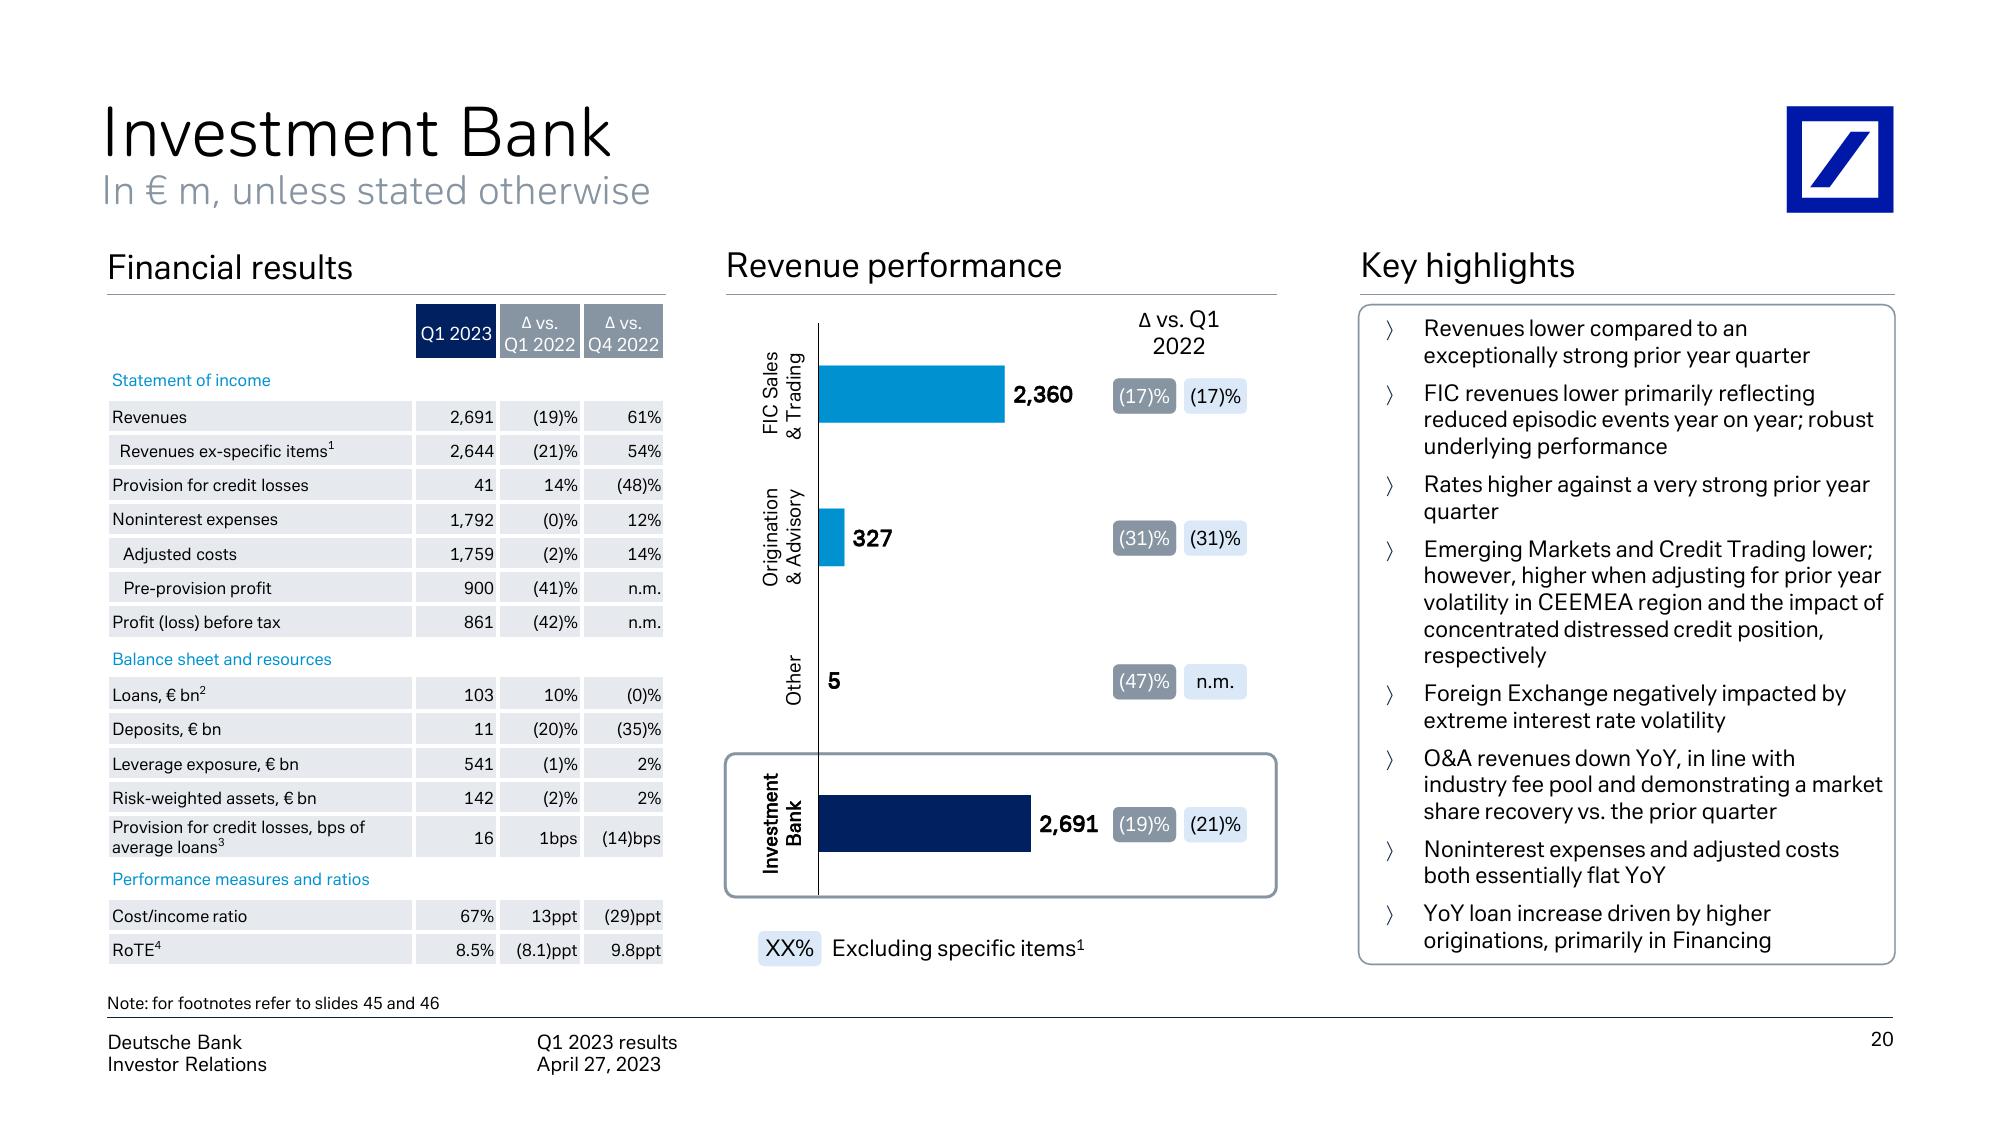
Revenues lower compared to an
exceptionally strong prior year quarter
FIC revenues lower primarily reflecting
reduced episodic events year on year; robust
underlying performance
Rates higher against a very strong prior year
quarter
Emerging Markets and Credit Trading lower;
however, higher when adjusting for prior year
volatility in CEEMEA region and the impact of
concentrated distressed credit position,
respectively
Foreign Exchange negatively impacted by
extreme interest rate volatility
O&A revenues down YoY, in line with
industry fee pool and demonstrating a market
share recovery vs. the prior quarter
Noninterest expenses and adjusted costs
both essentially flat YoY
YOY loan increase driven by higher
originations, primarily in Financing
20View entire presentation