ZipRecruiter Investor Presentation Deck
Reconciliations of non-GAAP financial measures to the most directly comparable
GAAP measures
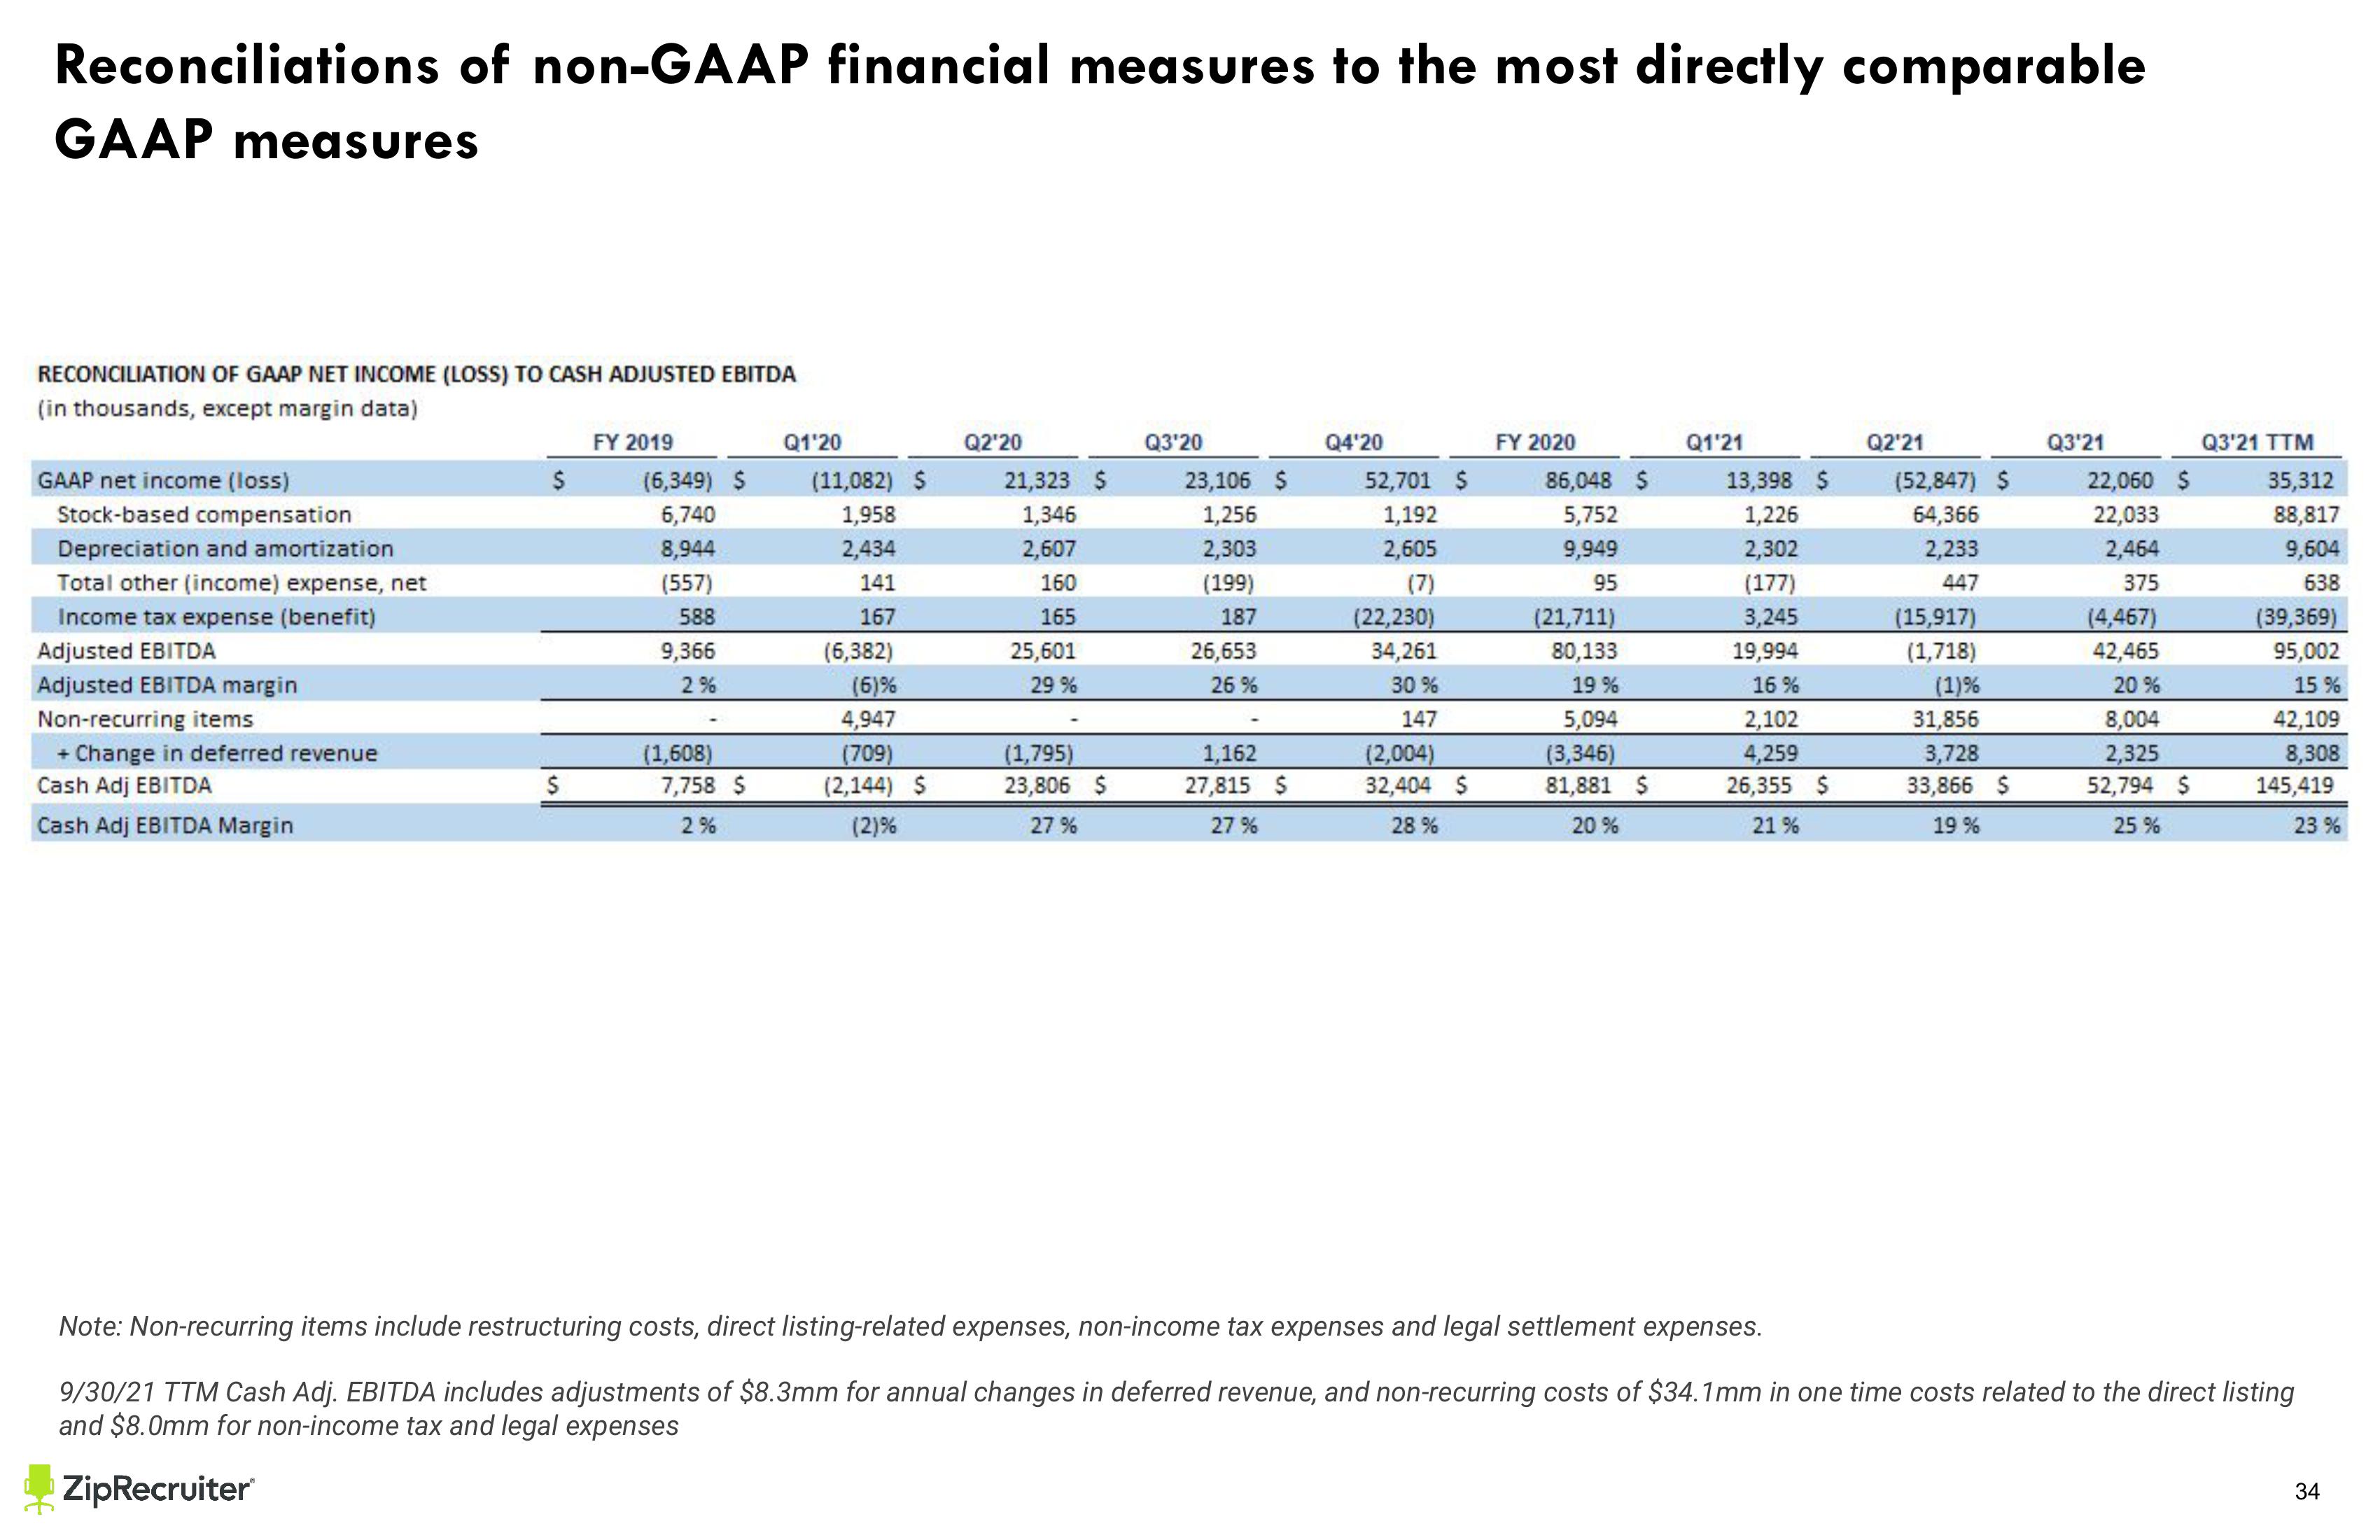
RECONCILIATION OF GAAP NET INCOME (LOSS) TO CASH ADJUSTED EBITDA
(in thousands, except margin data)
GAAP net income (loss)
Stock-based compensation
Depreciation and amortization
Total other (income) expense, net
Income tax expense (benefit)
Adjusted EBITDA
Adjusted EBITDA margin
Non-recurring items
+ Change in deferred revenue
Cash Adj EBITDA
Cash Adj EBITDA Margin
$
$
FY 2019
(6,349) $
6,740
8,944
(557)
588
9,366
2%
(1,608)
7,758 $
2%
Q1'20
(11,082) S
1,958
2,434
141
167
(6,382)
(6)%
4,947
(709)
(2,144) S
(2)%
Q2'20
21,323 $
1,346
2,607
160
165
25,601
29 %
(1,795)
23,806 $
27%
Q3'20
23,106 $
1,256
2,303
(199)
187
26,653
26%
1,162
27,815 $
27%
Q4'20
52,701 $
1,192
2,605
(7)
(22,230)
34,261
30%
147
(2,004)
32,404 $
28%
FY 2020
86,048 $
5,752
9,949
95
(21,711)
80,133
19 %
5,094
(3,346)
81,881 $
20%
Q1'21
13,398 $
1,226
2,302
(177)
3,245
19,994
16%
2,102
4,259
26,355 $
21%
Q2'21
(52,847) $
64,366
2,233
447
(15,917)
(1,718)
(1)%
31,856
3,728
33,866 $
19 %
Q3'21
22,060 $
22,033
2,464
375
(4,467)
42,465
20%
8,004
2,325
52,794 $
25%
Q3'21 TTM
35,312
88,817
9,604
638
(39,369)
95,002
15 %
42,109
8,308
145,419
23 %
Note: Non-recurring items include restructuring costs, direct listing-related expenses, non-income tax expenses and legal settlement expenses.
9/30/21 TTM Cash Adj. EBITDA includes adjustments of $8.3mm for annual changes in deferred revenue, and non-recurring costs of $34.1mm in one time costs related to the direct listing
and $8.0mm for non-income tax and legal expenses
ZipRecruiter
34View entire presentation