Liberty Global Results Presentation Deck
(1)
(2)
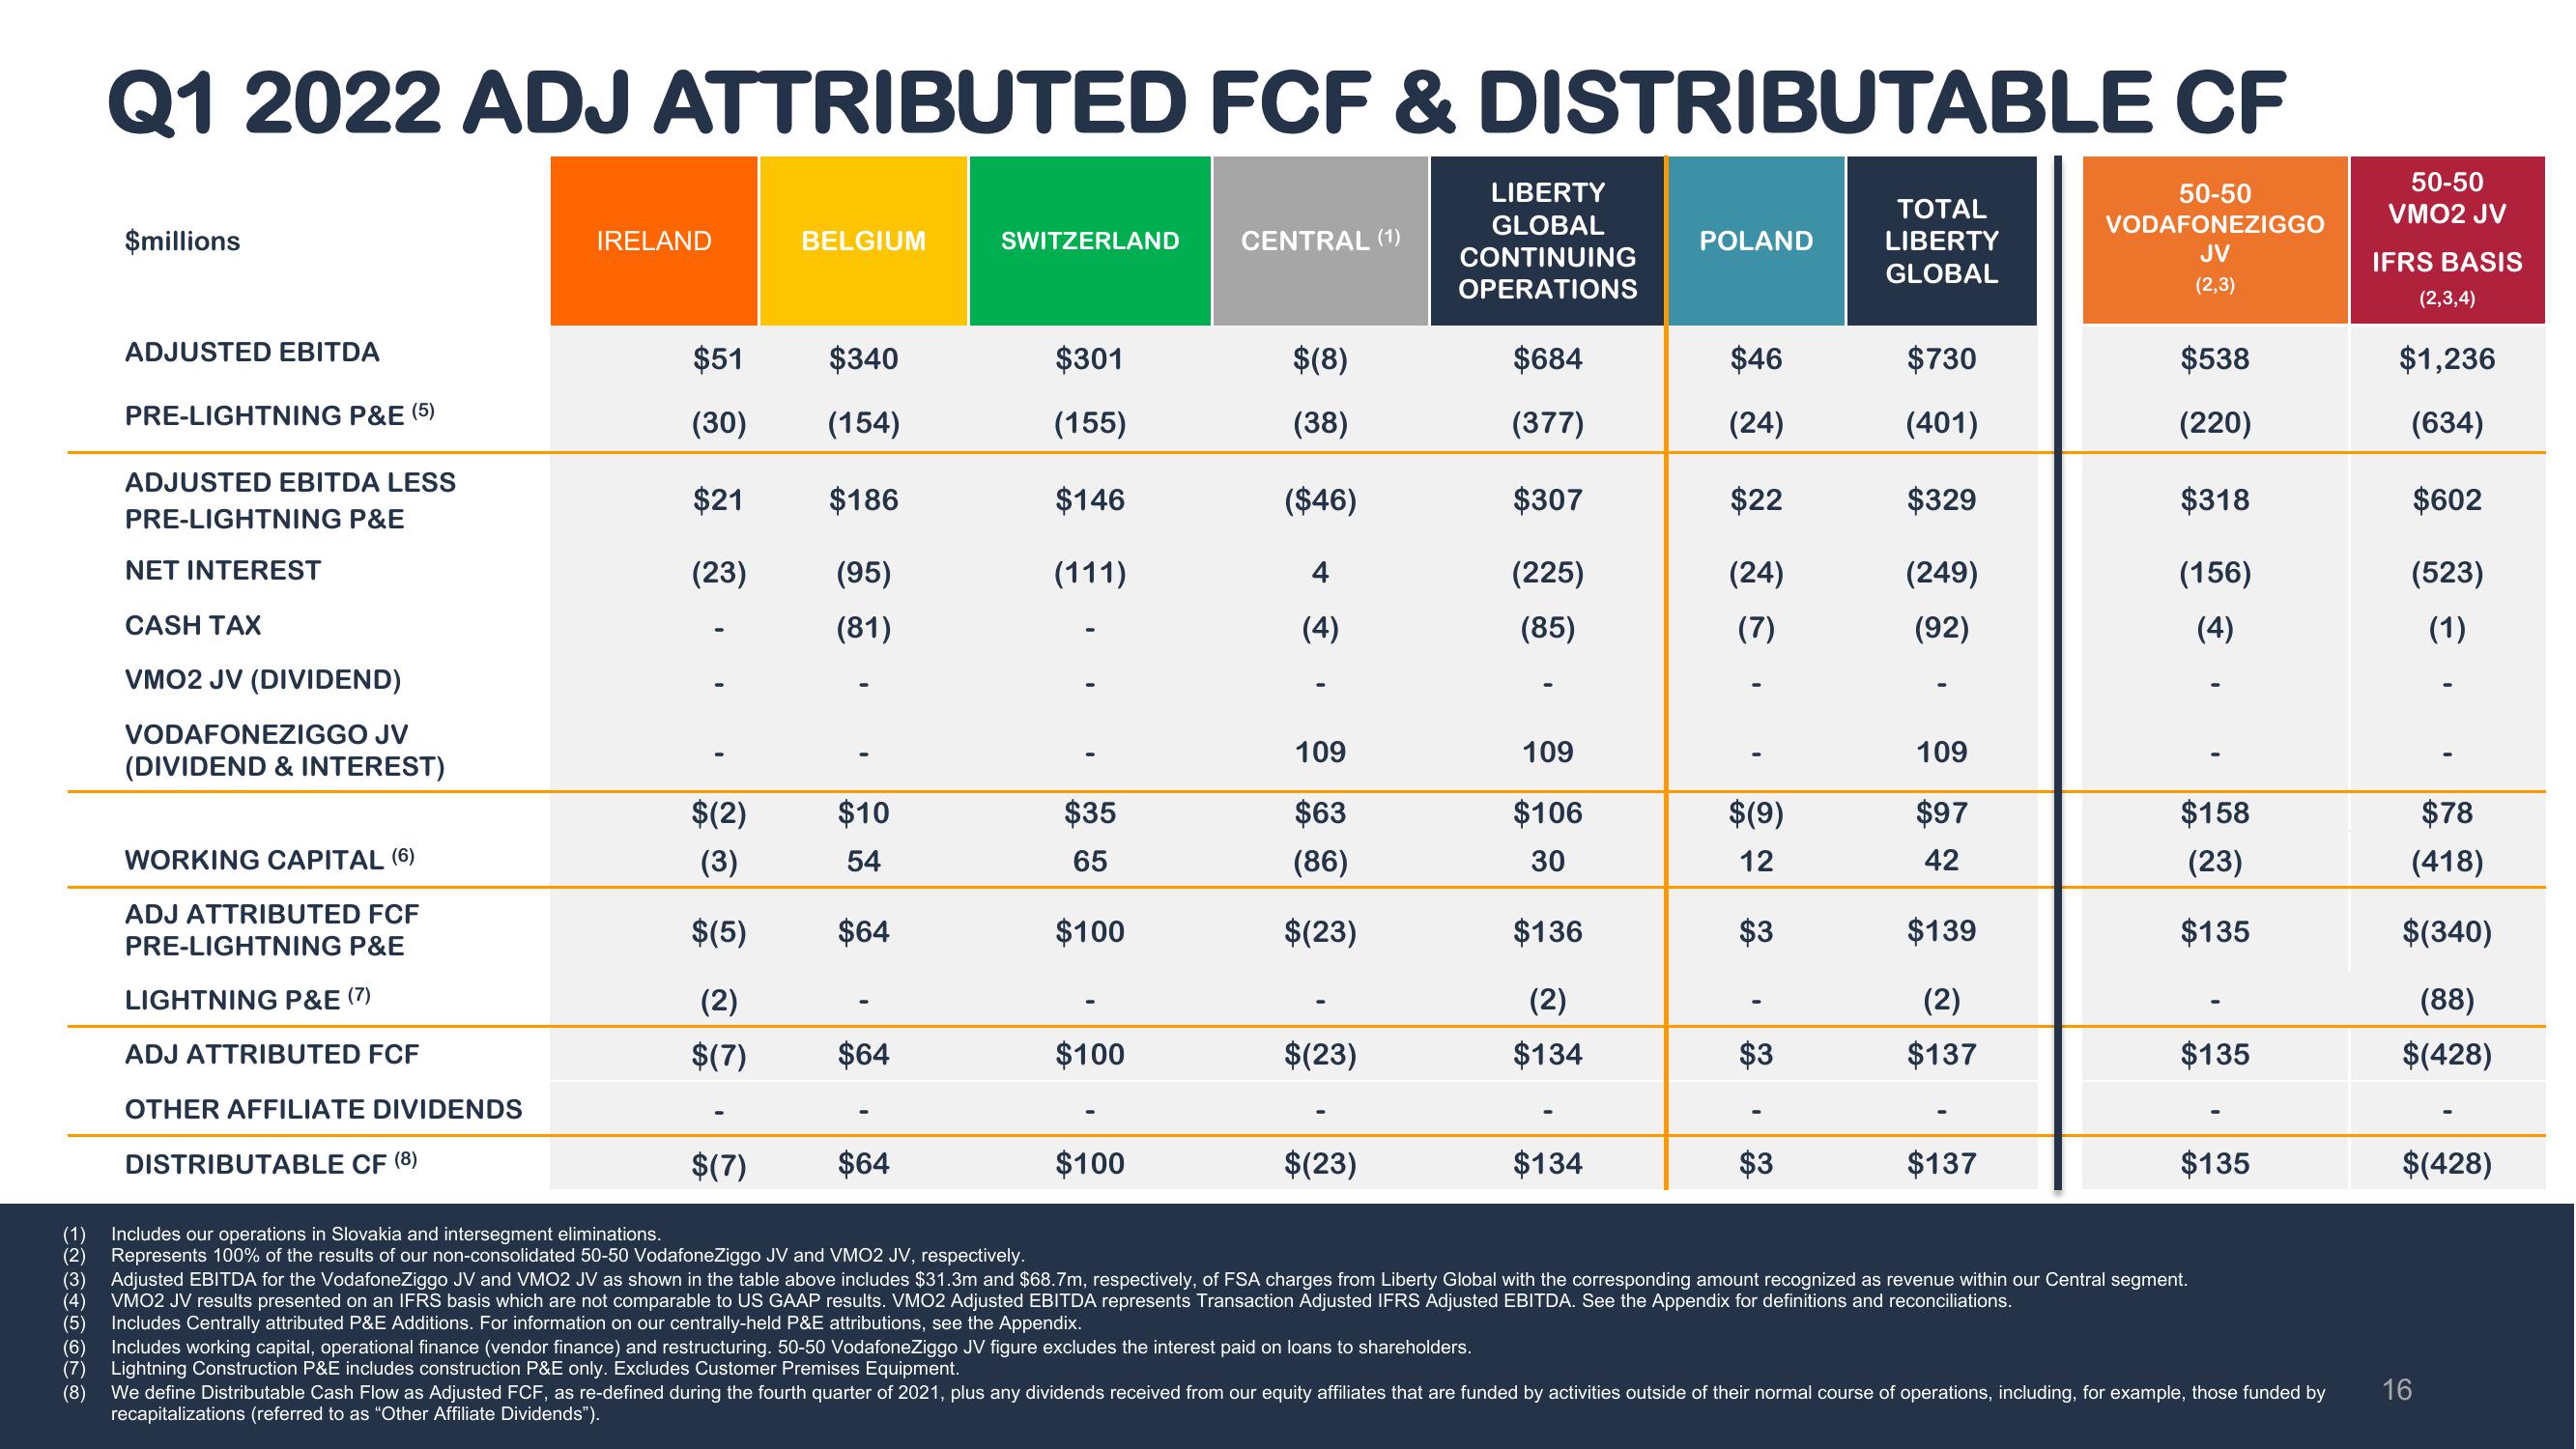
Q1 2022 ADJ ATTRIBUTED FCF & DISTRIBUTABLE CF
(3)
(4)
$millions
ADJUSTED EBITDA
PRE-LIGHTNING P&E (5)
ADJUSTED EBITDA LESS
PRE-LIGHTNING P&E
NET INTEREST
CASH TAX
VMO2 JV (DIVIDEND)
VODAFONEZIGGO JV
(DIVIDEND & INTEREST)
WORKING CAPITAL (6)
ADJ ATTRIBUTED FCF
PRE-LIGHTNING P&E
LIGHTNING P&E (7)
ADJ ATTRIBUTED FCF
OTHER AFFILIATE DIVIDENDS
DISTRIBUTABLE CF (8)
IRELAND
$51
(30)
$21
(23)
$(2)
(3)
$(5)
(2)
$(7)
$(7)
BELGIUM
$340
(154)
$186
(95)
(81)
$10
54
$64
$64
$64
SWITZERLAND
$301
(155)
$146
(111)
$35
65
$100
$100
$100
CENTRAL (1)
$(8)
(38)
($46)
4
(4)
1
109
$63
(86)
$(23)
$(23)
$(23)
LIBERTY
GLOBAL
CONTINUING
OPERATIONS
$684
(377)
$307
(225)
(85)
(6) Includes working capital, operational finance (vendor finance) and restructuring. 50-50 VodafoneZiggo JV figure excludes the interest paid on loans to shareholders.
(7) Lightning Construction P&E includes construction P&E only. Excludes Customer Premises Equipment.
109
$106
30
$136
(2)
$134
$134
POLAND
$46
(24)
$22
(24)
(7)
$(9)
12
$3
$3
$3
TOTAL
LIBERTY
GLOBAL
$730
(401)
$329
(249)
(92)
109
$97
42
$139
(2)
$137
$137
50-50
VODAFONEZIGGO
JV
(2,3)
$538
(220)
$318
(156)
(4)
$158
(23)
$135
$135
Includes our operations in Slovakia and intersegment eliminations.
Represents 100% of the results of our non-consolidated 50-50 VodafoneZiggo JV and VMO2 JV, respectively.
Adjusted EBITDA for the VodafoneZiggo JV and VMO2 JV as shown in the table above includes $31.3m and $68.7m, respectively, of FSA charges from Liberty Global with the corresponding amount recognized as revenue within our Central segment.
VMO2 JV results presented on an IFRS basis which are not comparable to US GAAP results. VMO2 Adjusted EBITDA represents Transaction Adjusted IFRS Adjusted EBITDA. See the Appendix for definitions and reconciliations.
(5) Includes Centrally attributed P&E Additions. For information on our centrally-held P&E attributions, see the Appendix.
$135
(8) We define Distributable Cash Flow as Adjusted FCF, as re-defined during the fourth quarter of 2021, plus any dividends received from our equity affiliates that are funded by activities outside of their normal course of operations, including, for example, those funded by
recapitalizations (referred to as "Other Affiliate Dividends").
50-50
VMO2 JV
IFRS BASIS
(2,3,4)
$1,236
(634)
$602
(523)
(1)
$78
(418)
$(340)
(88)
$(428)
$(428)
16View entire presentation