Vivid Seats Results Presentation Deck
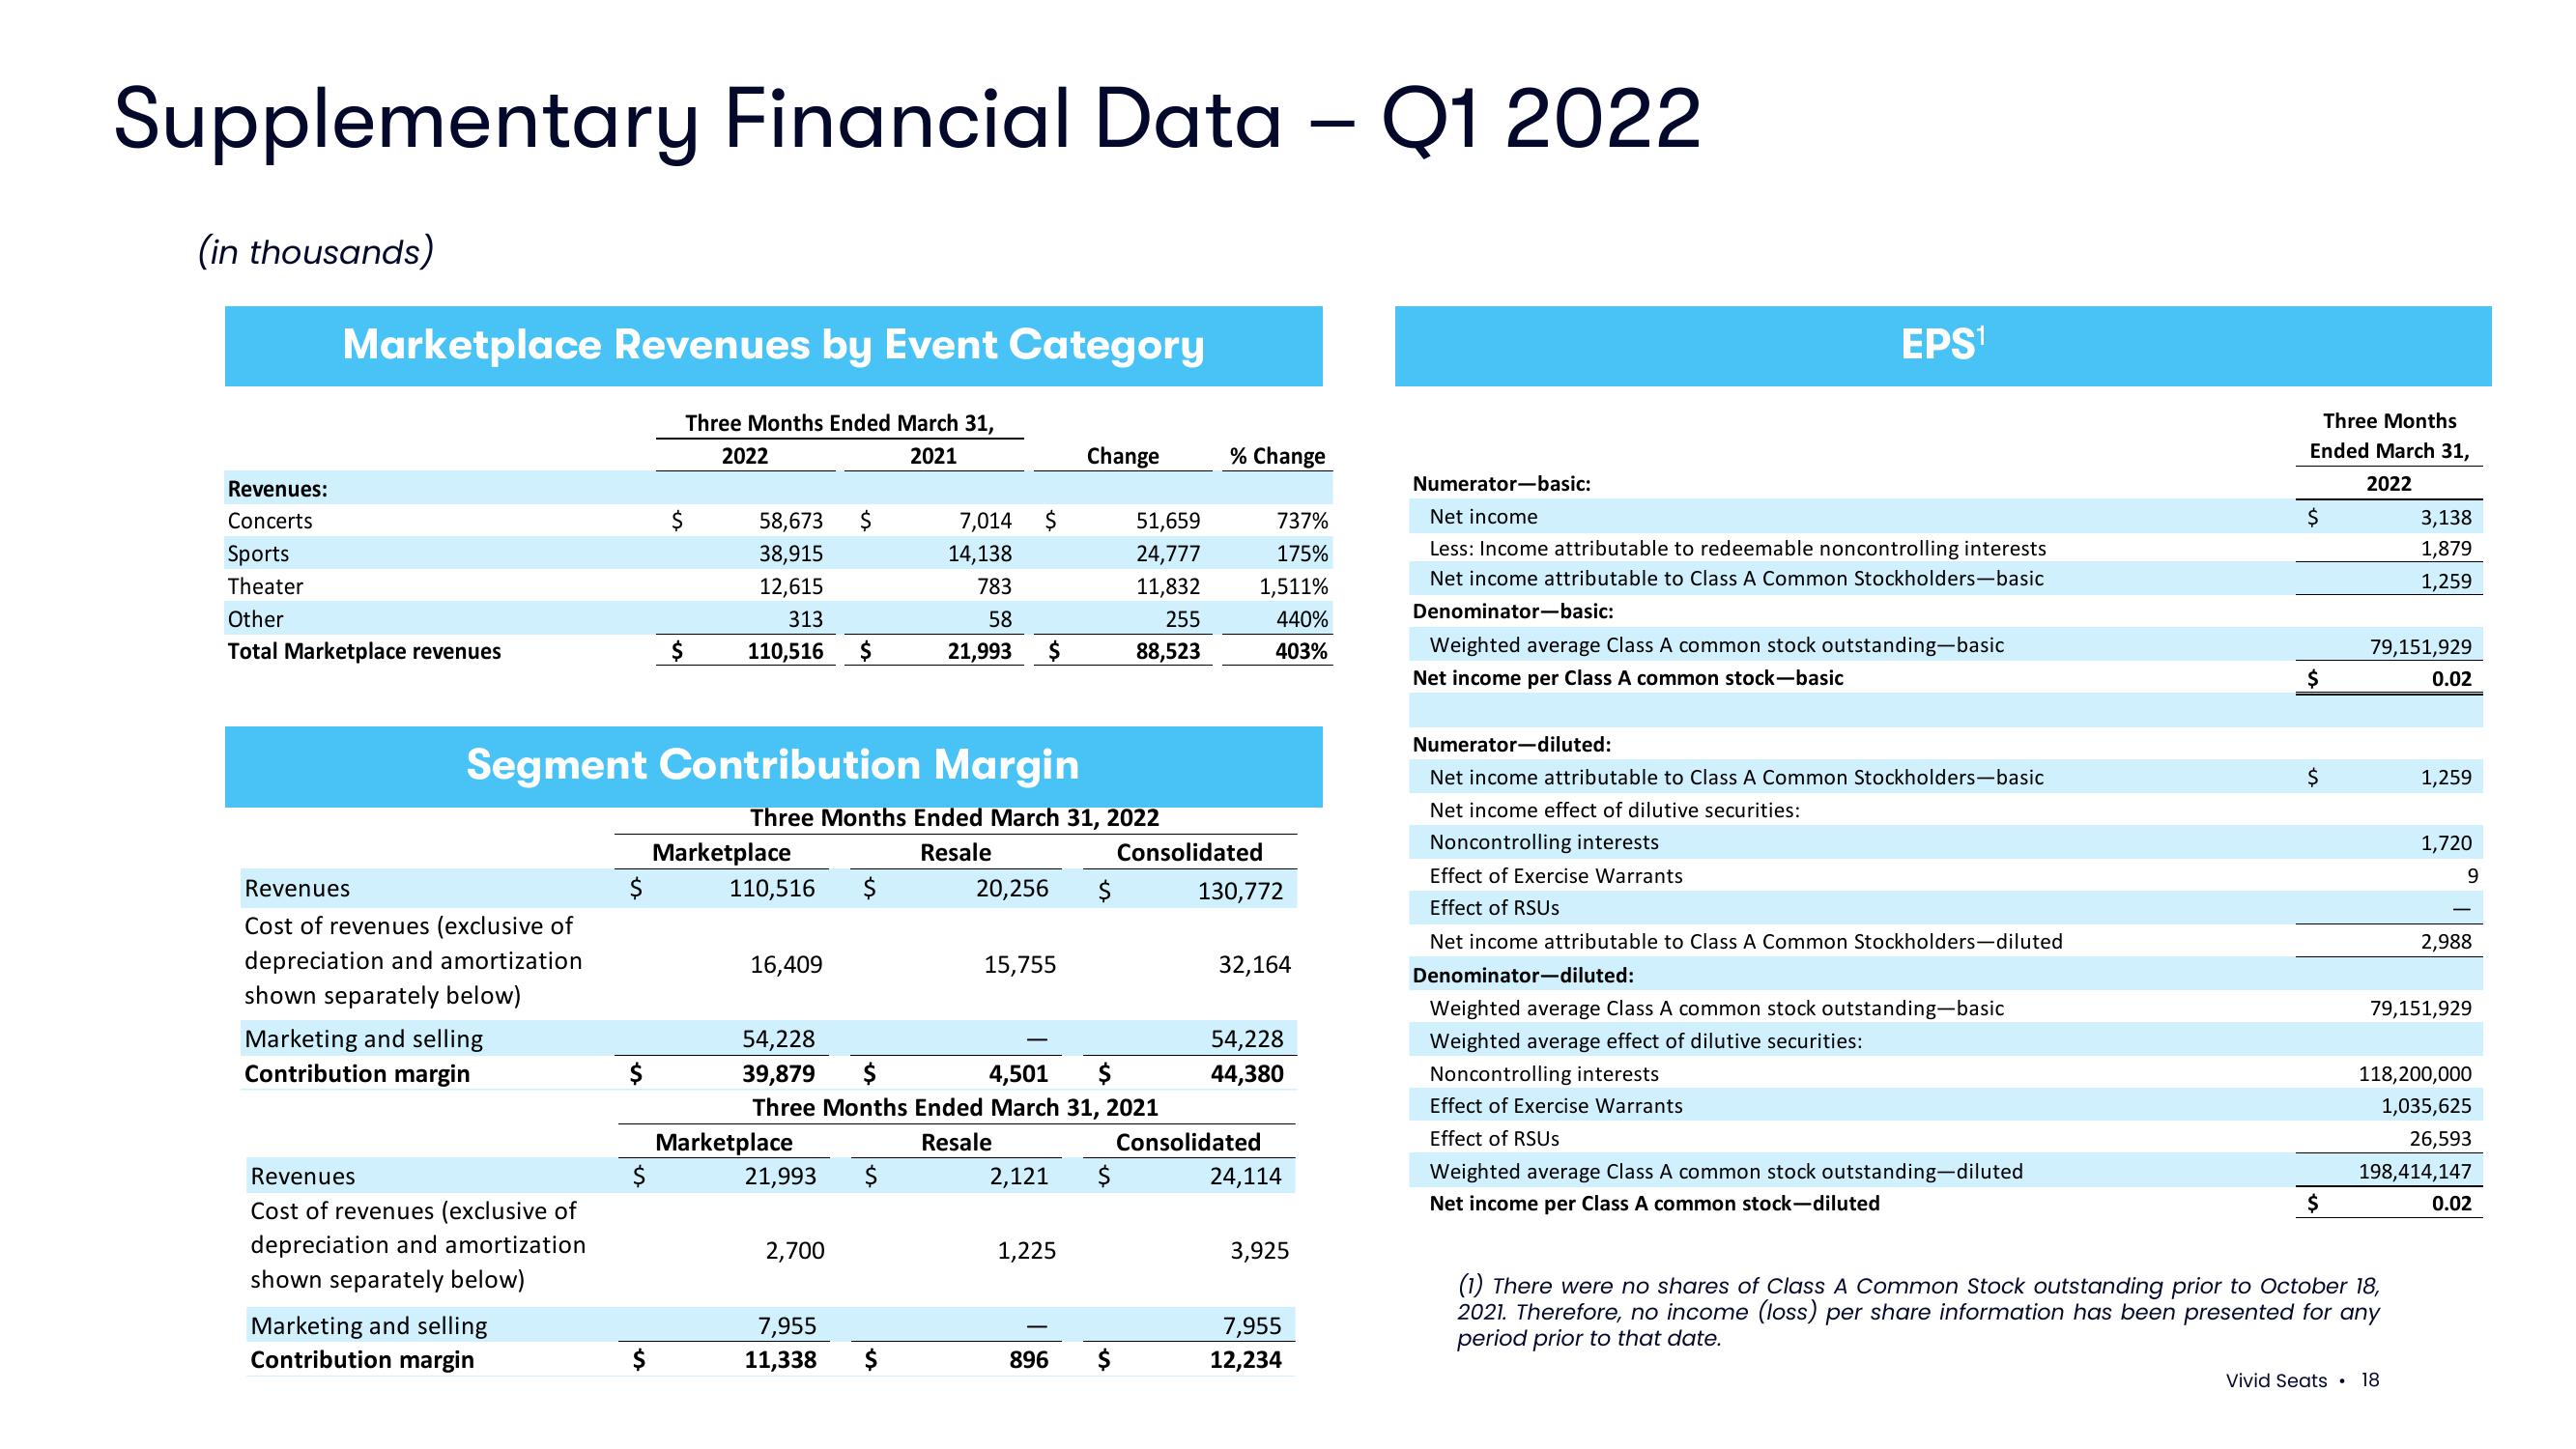
Supplementary Financial Data - Q1 2022
(in thousands)
Revenues:
Concerts
Sports
Theater
Marketplace Revenues by Event Category
Other
Total Marketplace revenues
Revenues
Cost of revenues (exclusive of
depreciation and amortization
shown separately below)
Marketing and selling
Contribution margin
Segment Contribution Margin
Revenues
Cost of revenues (exclusive of
depreciation and amortization
shown separately below)
Marketing and selling
Contribution margin
$
$
Three Months Ended March 31,
2022
2021
$
58,673 $
38,915
12,615
313
$ 110,516
Marketplace
110,516 $
Three Months Ended March 31, 2022
Resale
16,409
Marketplace
7,014
14,138
783
58
21,993 $
21,993 $
2,700
7,955
11,338 $
20,256
15,755
54,228
4,501 $
39,879 $
Three Months Ended March 31, 2021
Resale
2,121
Change
1,225
896
$
51,659
24,777
11,832
255
88,523
$
$
% Change
737%
175%
1,511%
440%
403%
Consolidated
130,772
32,164
54,228
44,380
Consolidated
24,114
3,925
7,955
12,234
EPS¹
Numerator-basic:
Net income
Less: Income attributable to redeemable non controlling interests
Net income attributable to Class A Common Stockholders-basic
Denominator-basic:
Weighted average Class A common stock outstanding-basic
Net income per Class A common stock-basic
Numerator-diluted:
Net income attributable to Class A Common Stockholders-basic
Net income effect of dilutive securities:
Noncontrolling interests
Effect of Exercise Warrants
Effect of RSUS
Net income attributable to Class A Common Stockholders-diluted
Denominator-diluted:
Weighted average Class A common stock outstanding-basic
Weighted average effect of dilutive securities:
Noncontrolling interests
Effect of Exercise Warrants
Effect of RSUS
Weighted average Class A common stock outstanding-diluted
Net income per Class common stock-diluted
Three Months
Ended March 31,
2022
$
$
$
$
79,151,929
0.02
3,138
1,879
1,259
(1) There were no shares of Class A Common Stock outstanding prior to October 18,
2021. Therefore, no income (loss) per share information has been presented for any
period prior to that date.
1,259
Vivid Seats. 18
1,720
9
79,151,929
2,988
118,200,000
1,035,625
26,593
198,414,147
0.02View entire presentation