First Quarter 2017 Financial Review
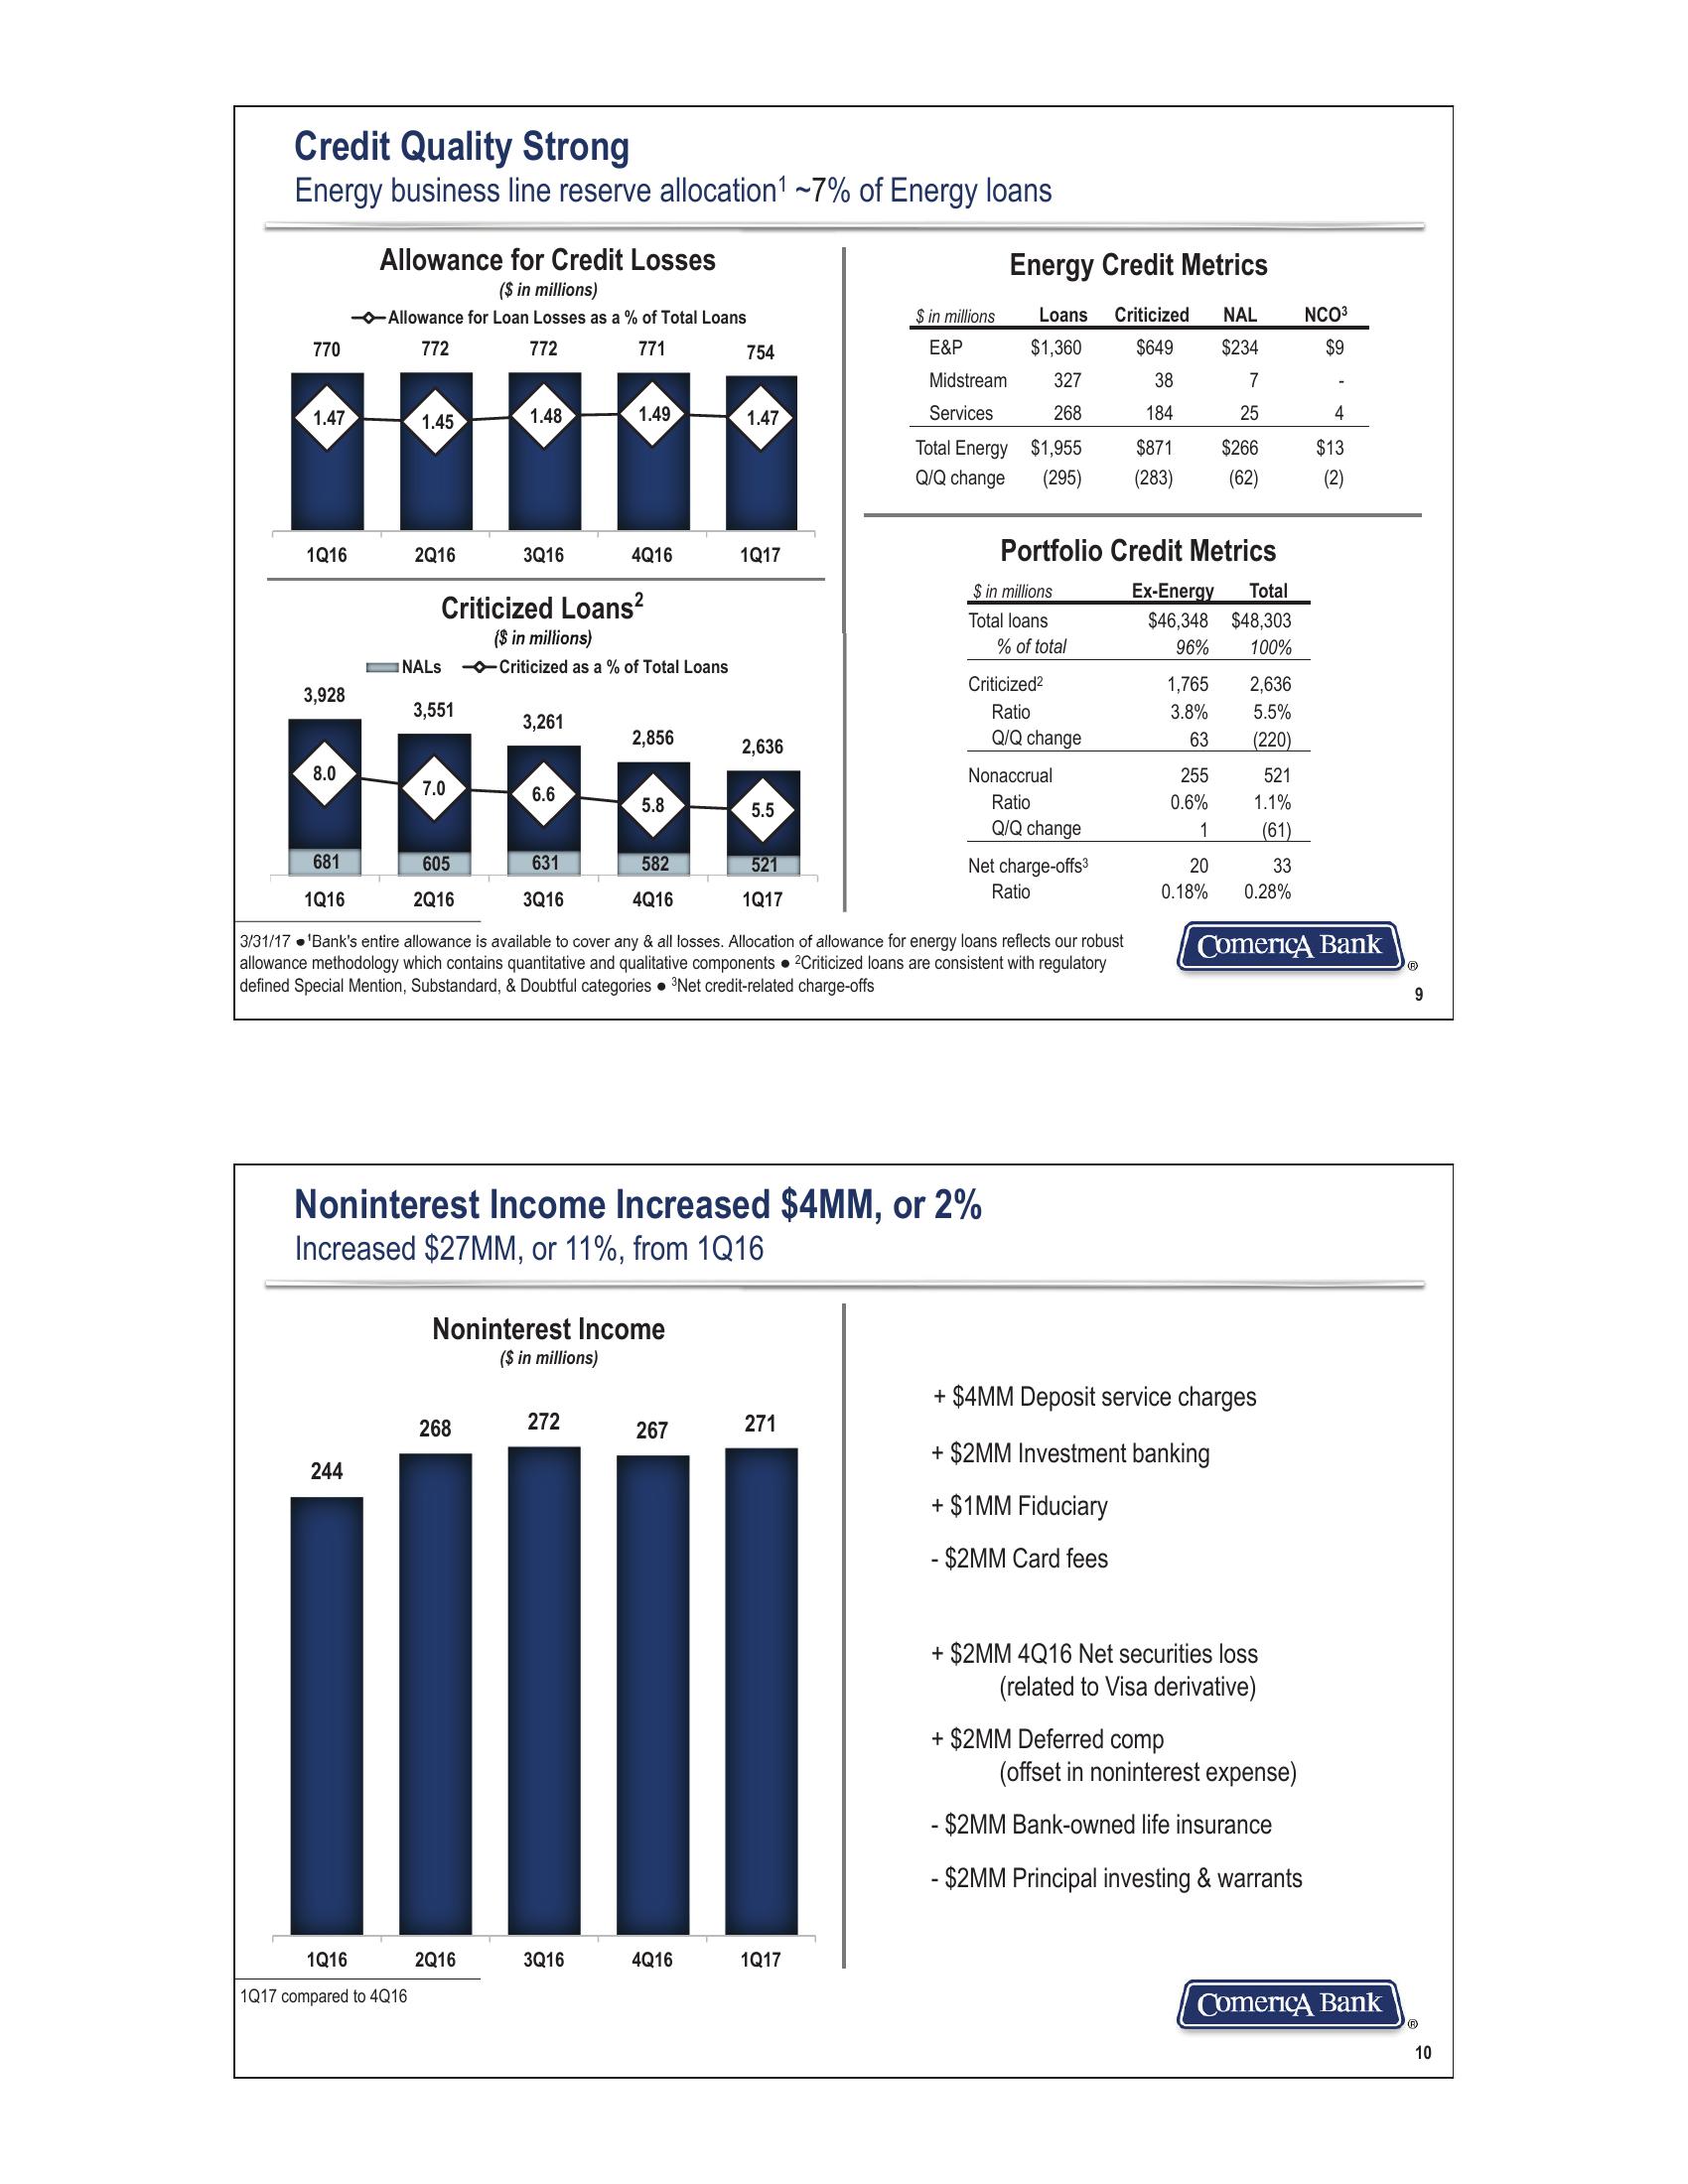
Credit Quality Strong
Energy business line reserve allocation¹ ~7% of Energy loans
Allowance for Credit Losses
($ in millions)
Allowance for Loan Losses as a % of Total Loans
Energy Credit Metrics
$ in millions
Loans Criticized NAL
NCO³
770
772
772
771
754
E&P
$1,360
$649
$234
$9
Midstream
327
38
7
1.47
1.45
1.48
1.49
1.47
Services
268
184
25
4
Total Energy $1,955
Q/Q change
$871
$266
$13
(295)
(283)
(62)
(2)
1Q16
2Q16
3Q16
Criticized Loans²
($ in millions)
NALS Criticized as a % of Total Loans
4Q16
1Q17
Portfolio Credit Metrics
$ in millions
Ex-Energy
Total
Total loans
$46,348
$48,303
% of total
96%
100%
Criticized²
1,765
2,636
3,928
3,551
Ratio
3.8%
5.5%
3,261
8.0
7.0
6.6
681
605
631
582
521
1Q16
2Q16
3Q16
4Q16
1Q17
00000
2,856
Q/Q change
63
2,636
(220)
Nonaccrual
255
521
5.8
5.5
Ratio
0.6%
1.1%
Q/Q change
1
(61)
Net charge-offs³
20
33
Ratio
0.18%
0.28%
3/31/17 'Bank's entire allowance is available to cover any & all losses. Allocation of allowance for energy loans reflects our robust
allowance methodology which contains quantitative and qualitative components 2Criticized loans are consistent with regulatory
defined Special Mention, Substandard, & Doubtful categories ³Net credit-related charge-offs
Comerica Bank
9
Noninterest Income Increased $4MM, or 2%
Increased $27MM, or 11%, from 1Q16
Noninterest Income
($ in millions)
272
268
271
267
24
244
1Q16
1Q17 compared to 4Q16
2Q16
3Q16
4Q16
1Q17
+ $4MM Deposit service charges
+ $2MM Investment banking
+$1MM Fiduciary
- $2MM Card fees
+$2MM 4Q16 Net securities loss
(related to Visa derivative)
+$2MM Deferred comp
(offset in noninterest expense)
- $2MM Bank-owned life insurance
- $2MM Principal investing & warrants
Comerica Bank
10View entire presentation