Kinnevik Results Presentation Deck
Intro
SEK m
GROUP FINANCIAL STATEMENTS
Change in fair value of financial assets
Dividends received
Consolidated Income Statement and report concerning Total Comprehensive Income
Administration costs
Other operating income
Other operating expenses
Operating profit/loss
Net Asset Value
Interest income and other financial income
Interest expenses and other financial expenses
Profit/loss after financial net
Tax
Net profit/loss for the period
Total comprehensive income for the period
Net profit/loss per share before dilution, SEK
Net profit/loss per share after dilution, SEK
Outstanding shares at the end of the period
Average number of shares before dilution
Average number of shares after dilution
KINNEVIK
Portfolio Overview
Interim Report. Q4 2022
Note
4
5
Q4 2022
-5 437
461
-148
3
0
-5 121
29
7
-5 085
0
-5 085
-5 085
-18.16
-18.16
280 076 174
Sustainability
280 076 174
280 076 174
Q4 2021
-4 062
563
-121
0
-3 616
192
-38
-3 462
-5
-3 467
-3 467
-12.46
-12.46
278 677 265
278 212 165
278 212 165
FY 2022
-22 856
3 538
-371
11
-1
-19 679
346
-186
-19 519
0
-19 519
-19 519
-69.83
-69.83
280 076 174
279 503 330
279 503 330
FY 2021
13 269
1 689
-319
10
-3
14 646
210
-74
14 782
-5
14 777
14 777
53.12
53.12
278 677 265
278 177 851
278 177 851
Financial Statements
Other
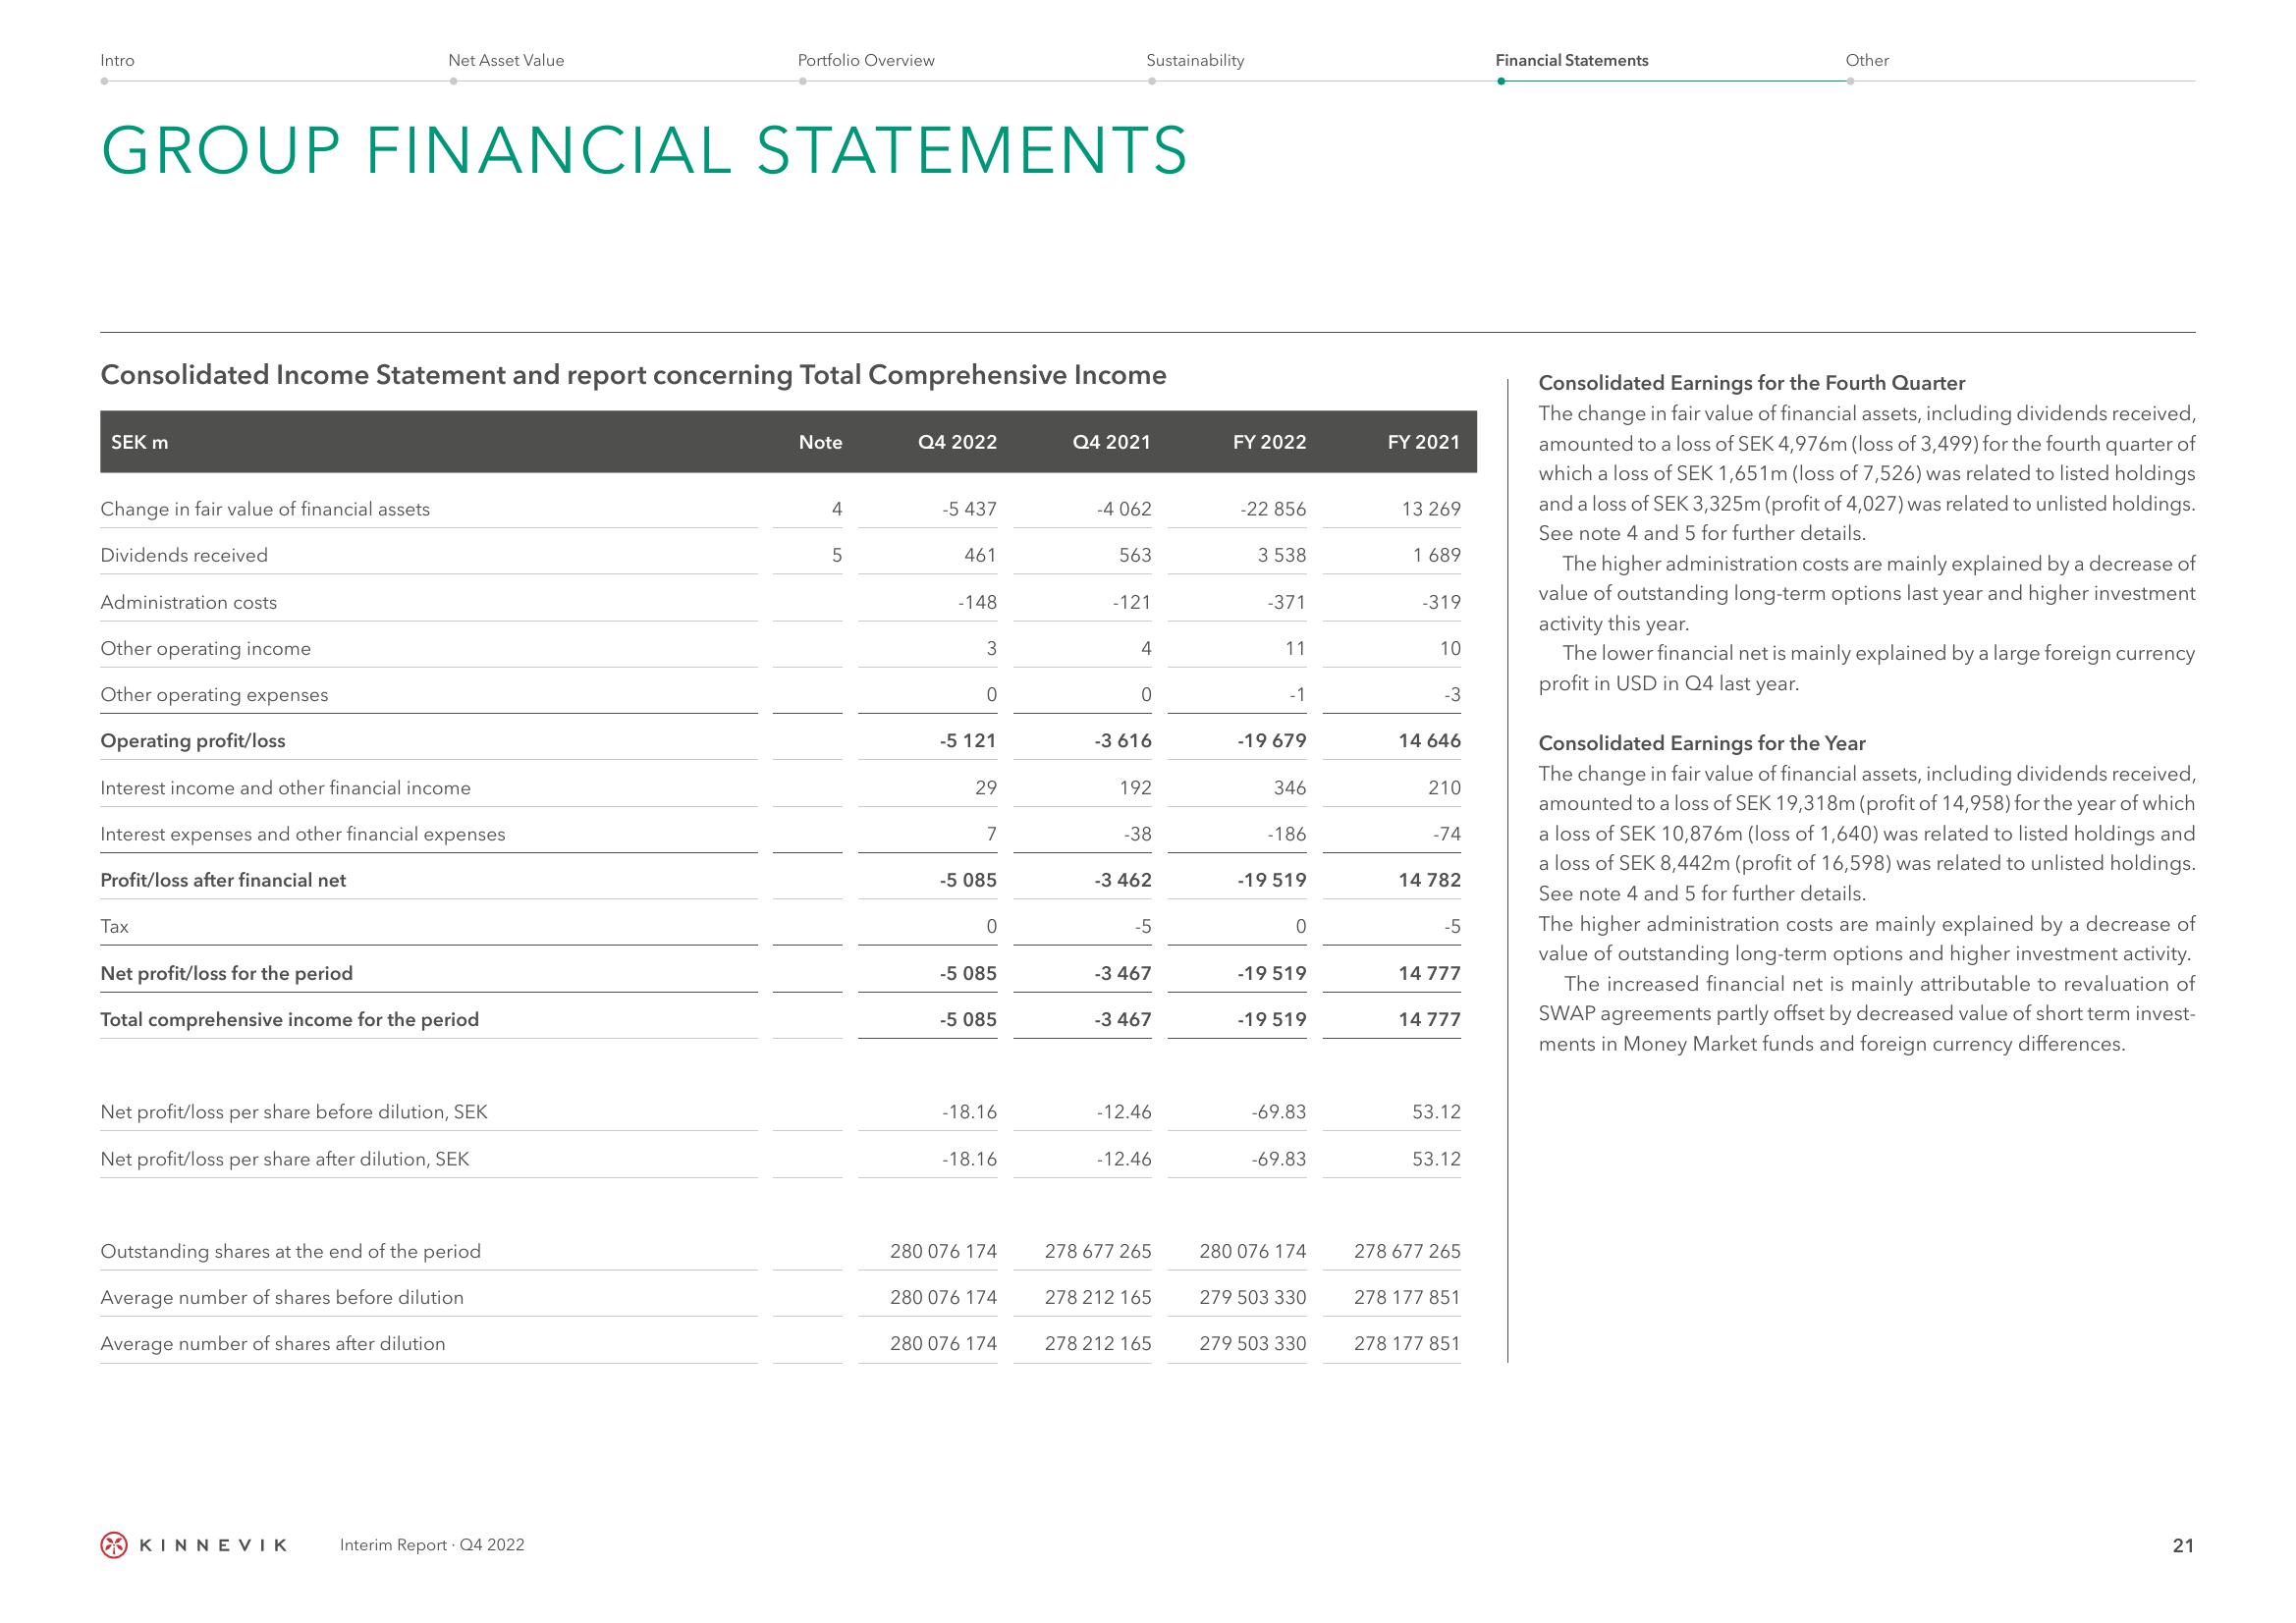
Consolidated Earnings for the Fourth Quarter
The change in fair value of financial assets, including dividends received,
amounted to a loss of SEK 4,976m (loss of 3,499) for the fourth quarter of
which a loss of SEK 1,651m (loss of 7,526) was related to listed holdings
and a loss of SEK 3,325m (profit of 4,027) was related to unlisted holdings.
See note 4 and 5 for further details.
The higher administration costs are mainly explained by a decrease of
value of outstanding long-term options last year and higher investment
activity this year.
The lower financial net is mainly explained by a large foreign currency
profit in USD in Q4 last year.
Consolidated Earnings for the Year
The change in fair value of financial assets, including dividends received,
amounted to a loss of SEK 19,318m (profit of 14,958) for the year of which
a loss of SEK 10,876m (loss of 1,640) was related to listed holdings and
a loss of SEK 8,442m (profit of 16,598) was related to unlisted holdings.
See note 4 and 5 for further details.
The higher administration costs are mainly explained by a decrease of
value of outstanding long-term options and higher investment activity.
The increased financial net is mainly attributable to revaluation of
SWAP agreements partly offset by decreased value of short term invest-
ments in Money Market funds and foreign currency differences.
21View entire presentation