SatixFy Investor Presentation Deck
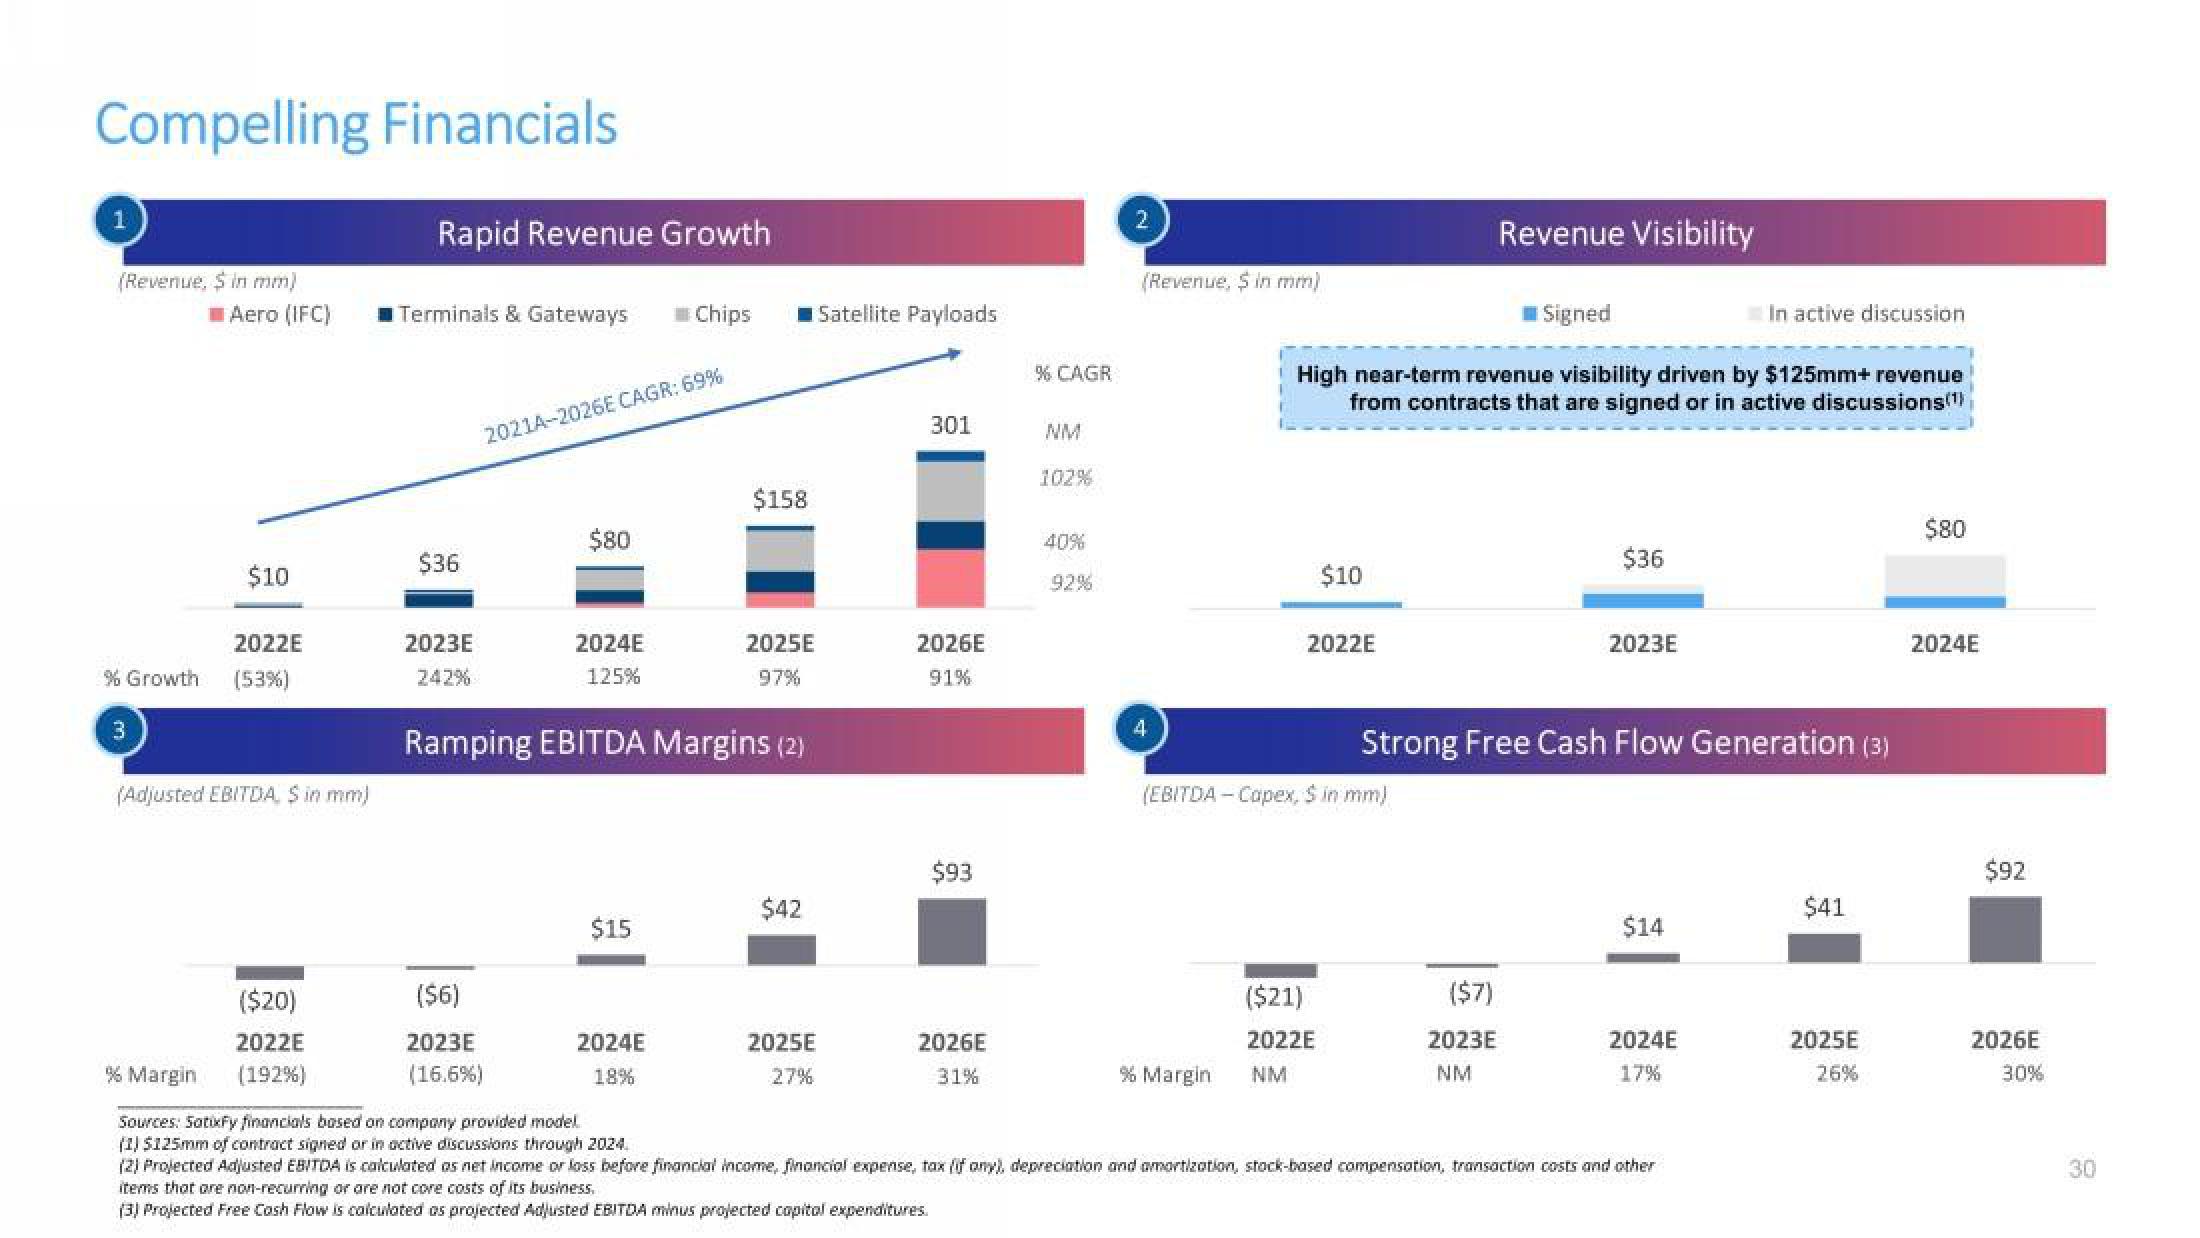
Compelling Financials
1
(Revenue, $ in mm)
Aero (IFC)
$10
2022E
% Growth (53%)
3
% Margin
(Adjusted EBITDA, S in mm)
($20)
2022E
(192%)
Rapid Revenue Growth
Terminals & Gateways
$36
2023E
242%
2021A-2026E CAGR: 69%
$80
($6)
2023E
(16.6%)
2024E
125%
2025E
97%
Ramping EBITDA Margins (2)
Chips
$15
2024E
18%
$158
$42
Satellite Payloads
2025E
27%
301
2026E
91%
$93
2026E
31%
% CAGR
NM
102%
40%
92%
2
(Revenue, $ in mm)
4
% Margin
$10
2022E
High near-term revenue visibility driven by $125mm+ revenue
from contracts that are signed or in active discussions(¹)
(EBITDA-Copex, $ in mm)
($21)
2022E
NM
Revenue Visibility
Signed
($7)
2023E
NM
$36
2023E
Strong Free Cash Flow Generation (3)
$14
In active discussion
2024E
17%
Sources: SatixFy financials based on company provided model.
(1) $125mm of contract signed or in active discussions through 2024.
(2) Projected Adjusted EBITDA is calculated as net income or loss before financial income, financial expense, tax (if any), depreciation and amortization, stock-based compensation, transaction costs and other
items that are non-recurring or are not core costs of its business.
(3) Projected Free Cash Flow is calculated as projected Adjusted EBITDA minus projected capital expenditures.
$41
2025E
26%
$80
2024E
$92
2026E
30%View entire presentation