Main Street Investor Presentation
MAIN Financial Performance
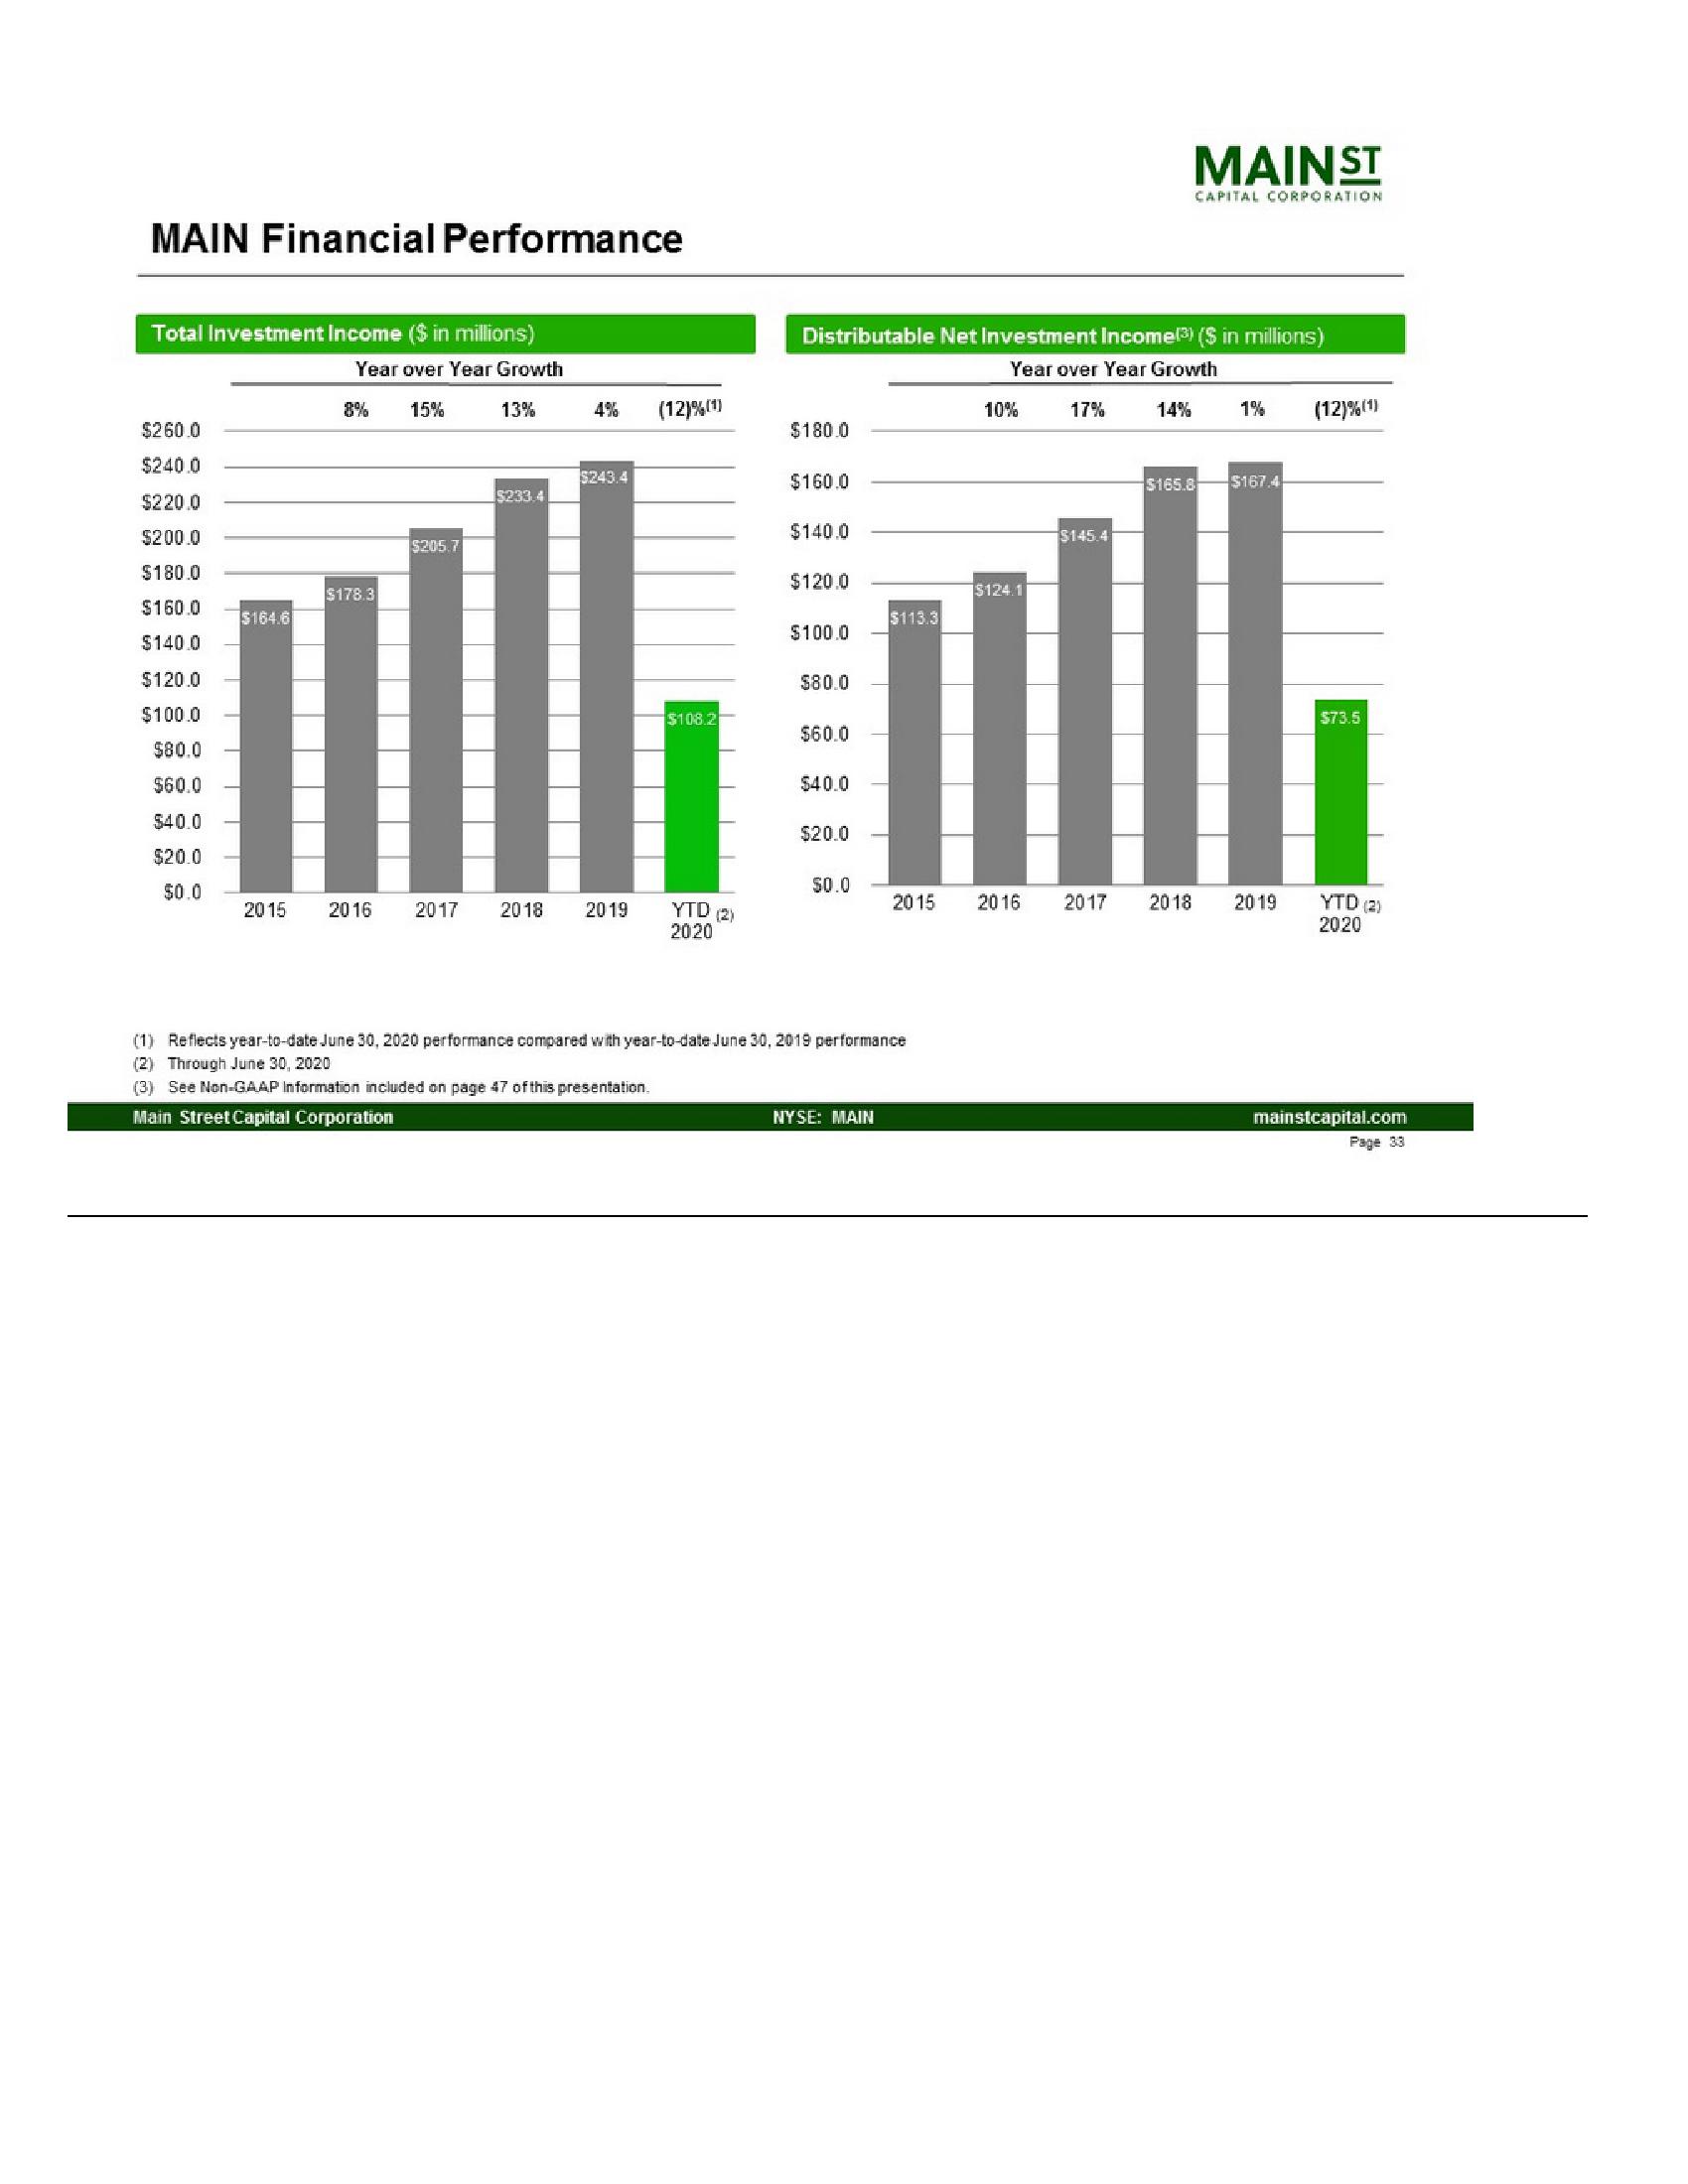
Total Investment Income ($ in millions)
Year over Year Growth
MAINST
CAPITAL CORPORATION
Distributable Net Investment Income(3) ($ in millions)
Year over Year Growth
8%
15%
13%
4%
(12)%(1)
10%
17%
14%
1%
(12)%(1)
$260.0
$180.0
$240.0
$220.0
$243.4
$233.4
$160.0
$165.8 $167.4
$140.0
$200.0
$145.4
$205.7
$180.0
$120.0
$124.11
$178.3
$160.0
$164.6
$113.3
$100.0
$140.0
$120.0
$80.0
$100.0
$108.2
$73.5
$60.0
$80.0
$60.0
$40.0
$40.0
$20.0
$20.0
50.0
$0.0
2015
2016
2017
2018
2019
YTD (2)
2020
2015
2016
2017 2018
2019
YTD (2)
2020
(1) Reflects year-to-date June 30, 2020 performance compared with year-to-date June 30, 2019 performance
(2) Through June 30, 2020
(3) See Non-GAAP Information included on page 47 of this presentation.
Main Street Capital Corporation
NYSE: MAIN
mainstcapital.com
Page 33View entire presentation