Credit Suisse Results Presentation Deck
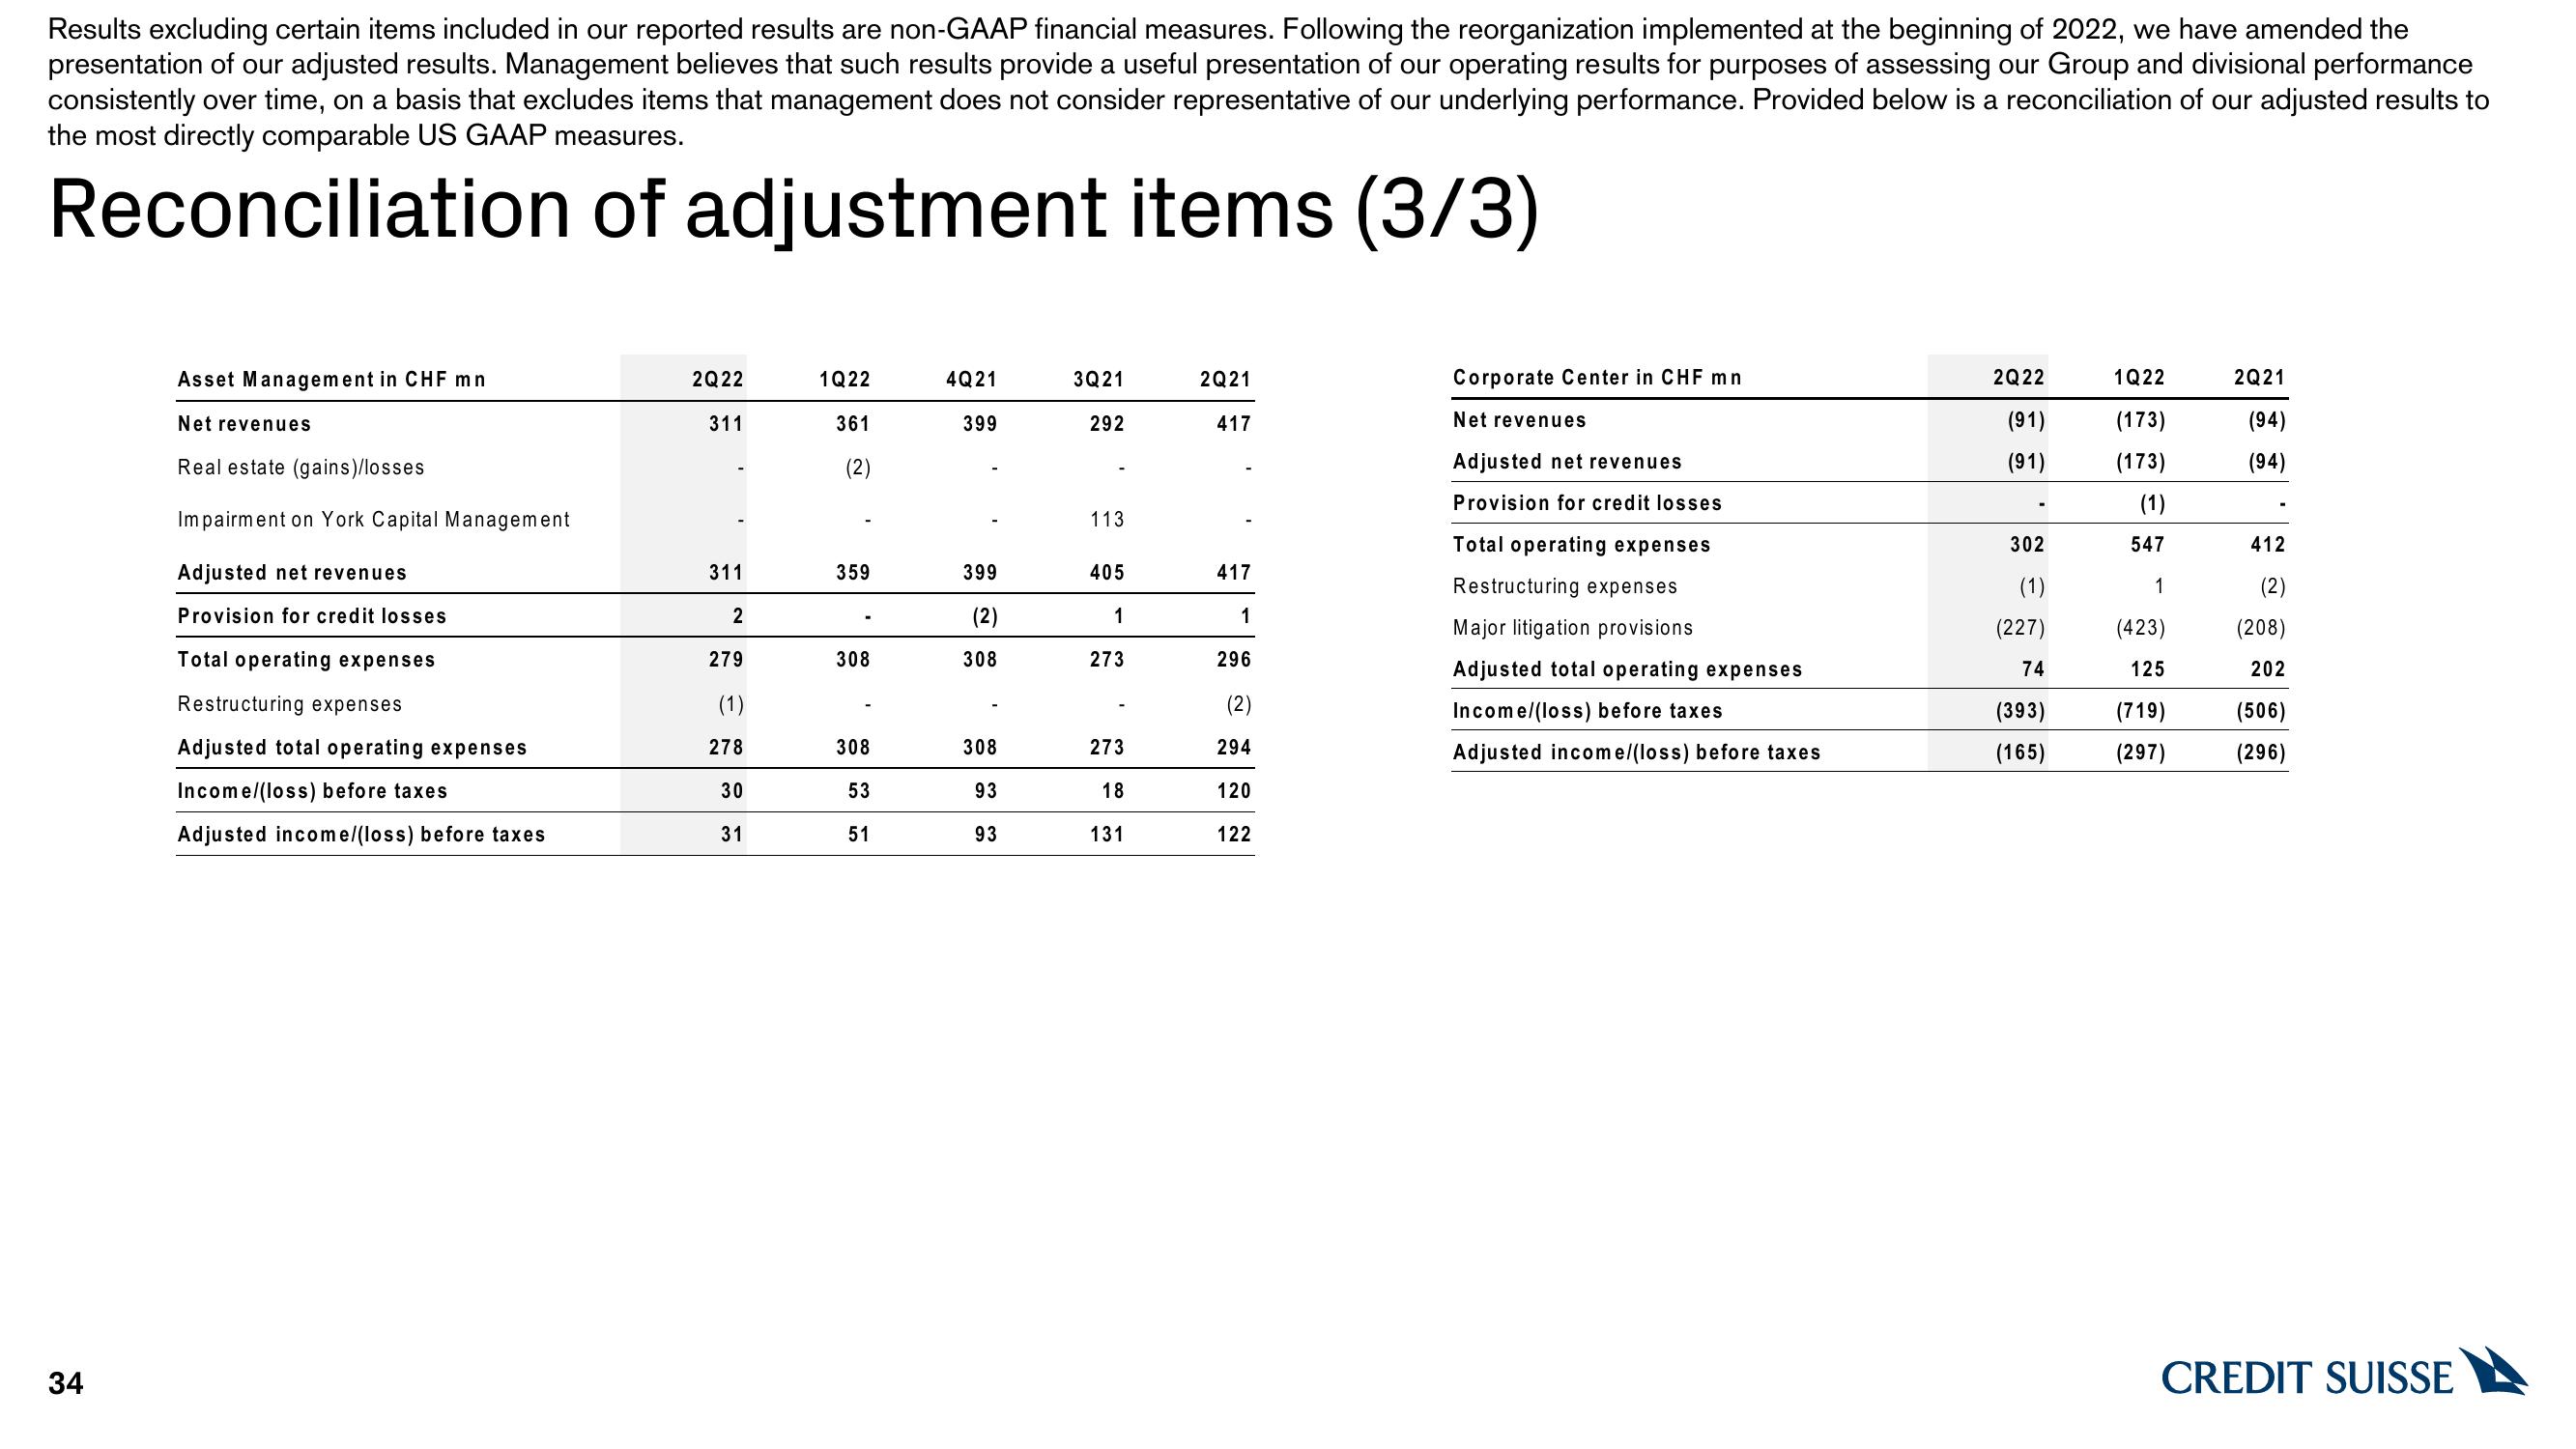
Results excluding certain items included in our reported results are non-GAAP financial measures. Following the reorganization implemented at the beginning of 2022, we have amended the
presentation of our adjusted results. Management believes that such results provide a useful presentation of our operating results for purposes of assessing our Group and divisional performance
consistently over time, on a basis that excludes items that management does not consider representative of our underlying performance. Provided below is a reconciliation of our adjusted results to
the most directly comparable US GAAP measures.
Reconciliation of adjustment items (3/3)
34
Asset Management in CHF mn
Net revenues
Real estate (gains)/losses
Impairment on York Capital Management
Adjusted net revenues
Provision for credit losses
Total operating expenses
Restructuring expenses
Adjusted total operating expenses
Income/(loss) before taxes
Adjusted income/(loss) before taxes.
2Q22
311
311
2
279
(1)
278
30
31
1Q22
361
359
308
308
53
51
4Q21
399
399
(2)
308
308
93
93
3Q21
292
113
405
1
273
273
18
131
2Q21
417
417
1
296
(2)
294
120
122
Corporate Center in CHF mn
Net revenues
Adjusted net revenues
Provision for credit losses
Total operating expenses
Restructuring expenses
Major litigation provisions
Adjusted total operating expenses
Income/(loss) before taxes
Adjusted income/(loss) before taxes
2Q22
(91)
(91)
302
(1)
(227)
74
(393)
(165)
1Q22
(173)
(173)
(1)
547
1
(423)
125
(719)
(297)
2Q21
(94)
(94)
412
(2)
(208)
202
(506)
(296)
CREDIT SUISSEView entire presentation