Maersk Results Presentation Deck
Maersk Group
- Interim Report 03 2015
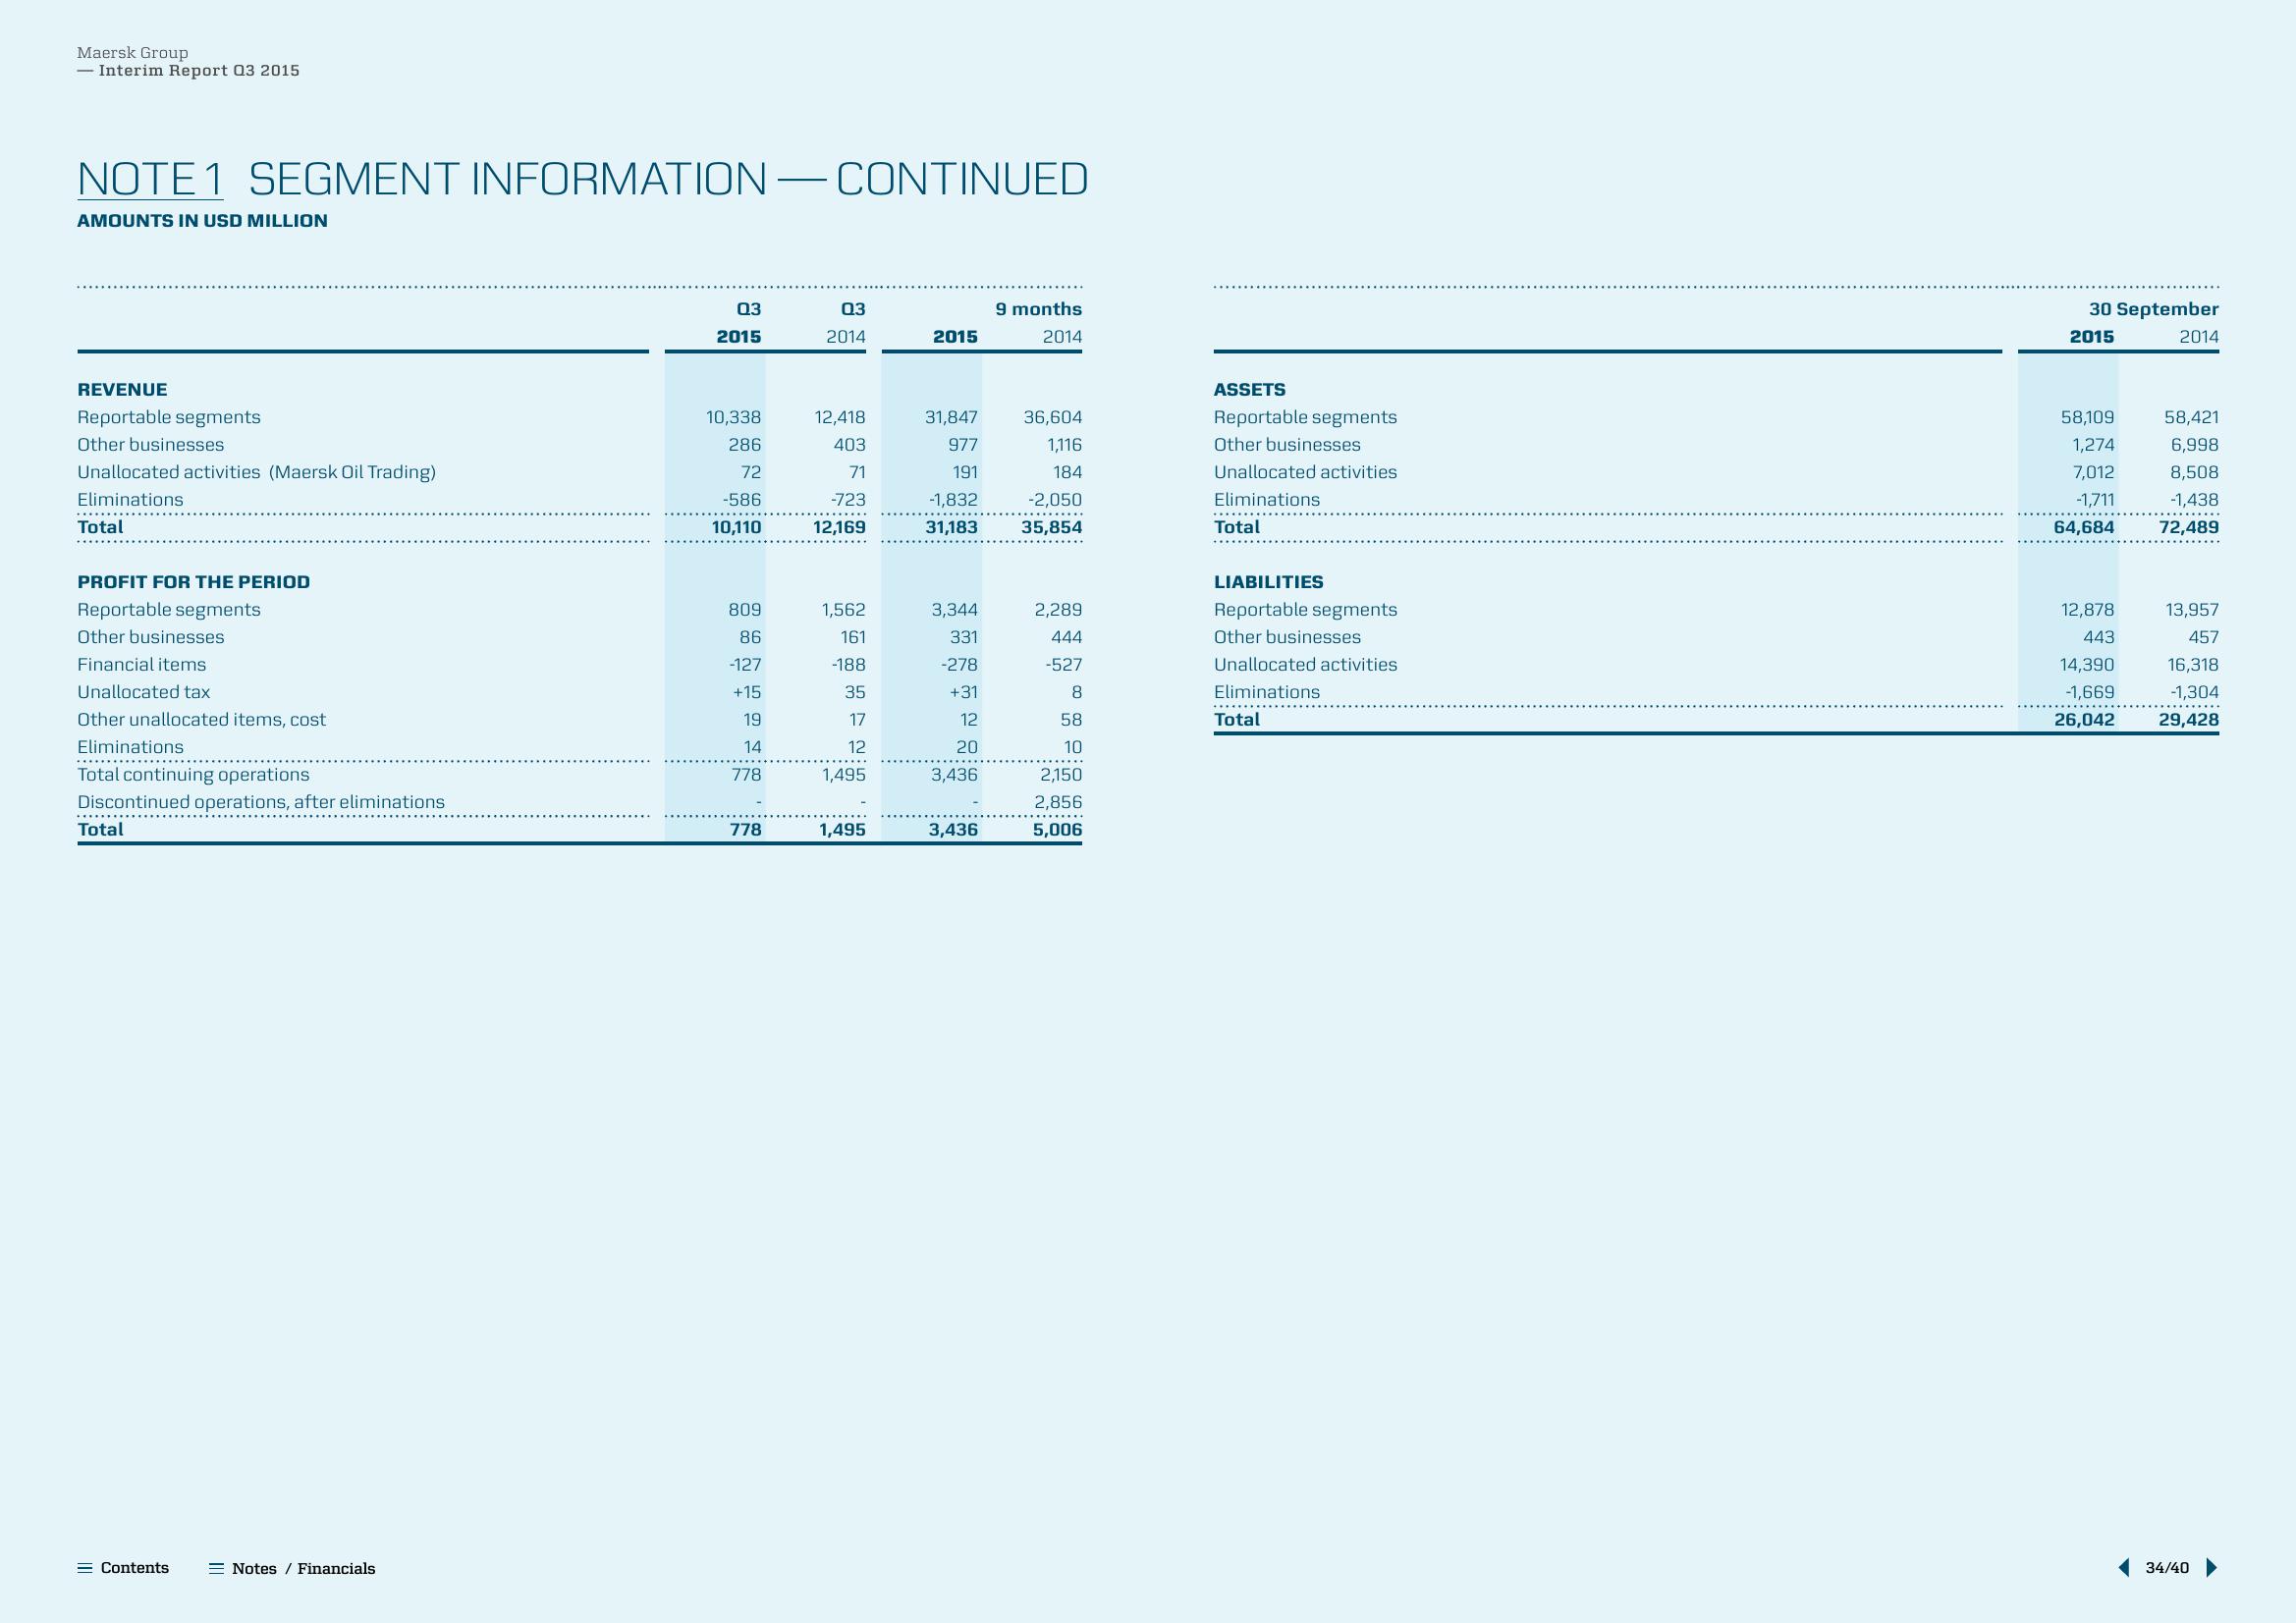
NOTE 1 SEGMENT INFORMATION CONTINUED
AMOUNTS IN USD MILLION
REVENUE
Reportable segments
Other businesses
Unallocated activities (Maersk Oil Trading)
Eliminations
********
Total
PROFIT FOR THE PERIOD
Reportable segments
Other businesses
Financial items
Unallocated tax
Other unallocated items, cost
Eliminations
Total continuing operations
Discontinued operations, after eliminations
Total
= Contents
Notes / Financials
03
2015
10,338
286
72
-586
10,110
809
86
-127
+15
19
14
778
778
- —
03
2014
12,418
403
71
-723
12,169
1,562
161
-188
35
17
12
1,495
1,495
2015
31,847
977
191
-1,832
31,183
3,344
331
-278
+31
12
20
3,436
3,436
9 months
2014
36,604
1,116
184
-2,050
35,854
2,289
444
-527
8
58
10
2,150
2,856
5,006
ASSETS
Reportable segments
Other businesses
Unallocated activities.
Eliminations
..........
Total
LIABILITIES
Reportable segments
Other businesses
Unallocated activities
Eliminations
Total
30 September
2015
58,109
1,274
7,012
-1,711
64,684
12,878
443
14,390
-1,669
26,042
2014
58,421
6,998
8,508
-1,438
72,489
13,957
457
16,318
-1,304
29,428
34/40View entire presentation