Kore Results Presentation Deck
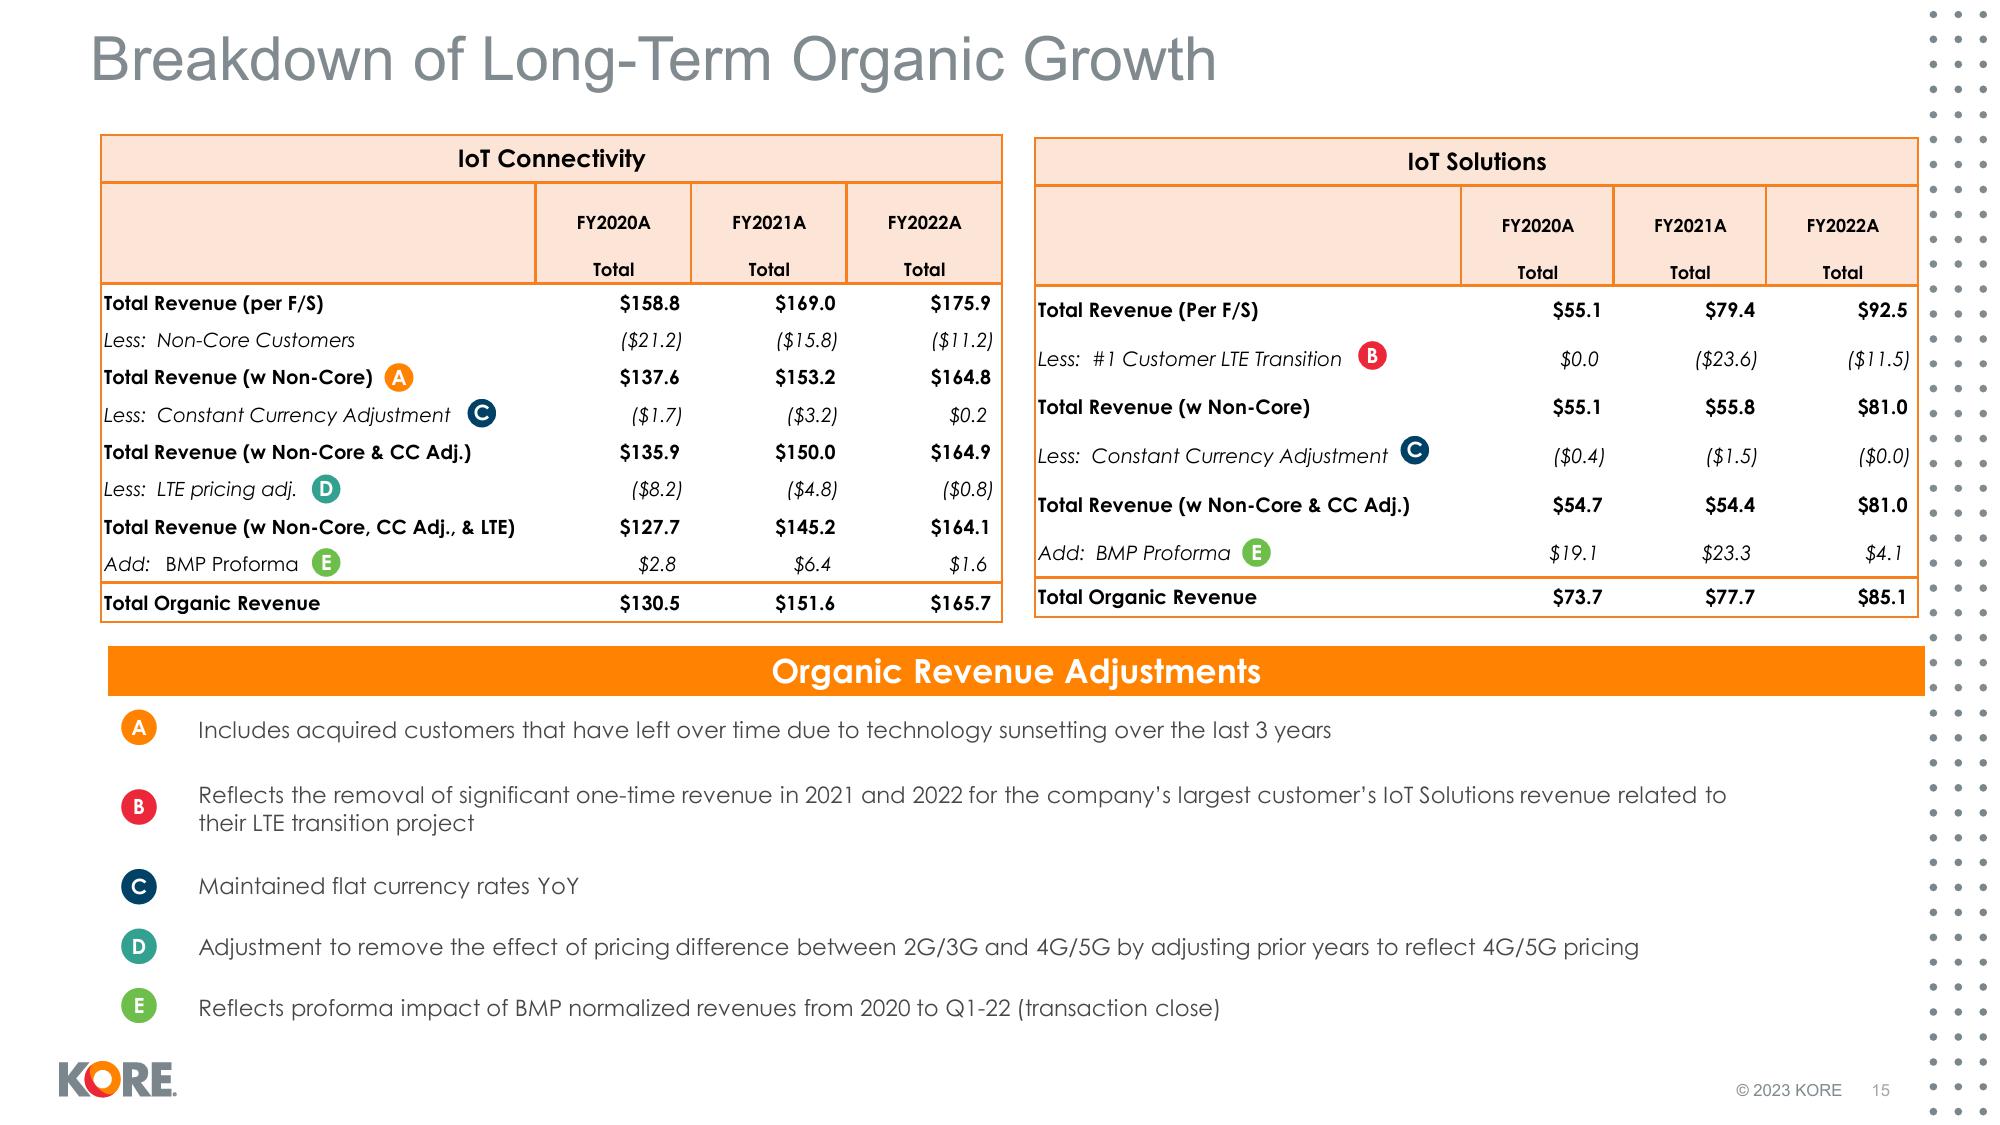
Breakdown of Long-Term Organic Growth
Total Revenue (per F/S)
Less: Non-Core Customers
Total Revenue (w Non-Core)
Less: Constant Currency Adjustment C
Total Revenue (w Non-Core & CC Adj.)
Less: LTE pricing adj. D
Total Revenue (w Non-Core, CC Adj., & LTE)
Add: BMP Proforma
Total Organic Revenue
A
B
C
D
IoT Connectivity
E
KORE
FY2020A
Total
$158.8
($21.2)
$137.6
($1.7)
$135.9
($8.2)
$127.7
$2.8
$130.5
FY2021A
Total
$169.0
($15.8)
$153.2
($3.2)
$150.0
($4.8)
$145.2
$6.4
$151.6
FY2022A
Total
$175.9
($11.2)
$164.8
$0.2
$164.9
($0.8)
$164.1
$1.6
$165.7
IoT Solutions
Total Revenue (Per F/S)
Less: #1 Customer LTE Transition B
Total Revenue (w Non-Core)
Less: Constant Currency Adjustment
Total Revenue (w Non-Core & CC Adj.)
Add: BMP Proforma E
Total Organic Revenue
Organic Revenue Adjustments
Includes acquired customers that have left over time due to technology sunsetting over the last 3 years
FY2020A
Total
$55.1
$0.0
$55.1
($0.4)
$54.7
$19.1
$73.7
FY2021A
Maintained flat currency rates YOY
Adjustment to remove the effect of pricing difference between 2G/3G and 4G/5G by adjusting prior years to reflect 4G/5G pricing
Reflects proforma impact of BMP normalized revenues from 2020 to Q1-22 (transaction close)
Total
$79.4
($23.6)
$55.8
($1.5)
$54.4
$23.3
$77.7
Reflects the removal of significant one-time revenue in 2021 and 2022 for the company's largest customer's loT Solutions revenue related to
their LTE transition project
FY2022A
Total
$92.5
($11.5)
$81.0
($0.0)
$81.0
$4.1
$85.1
© 2023 KORE 15
●
● ●
●
•
● ●
●
●
e
● ● ●
..
●
●●
•
● •
●
●
● ●
● ● G
•
•
●
● ●
●
e
●
●
● ●View entire presentation