Toyota Investor Presentation Deck
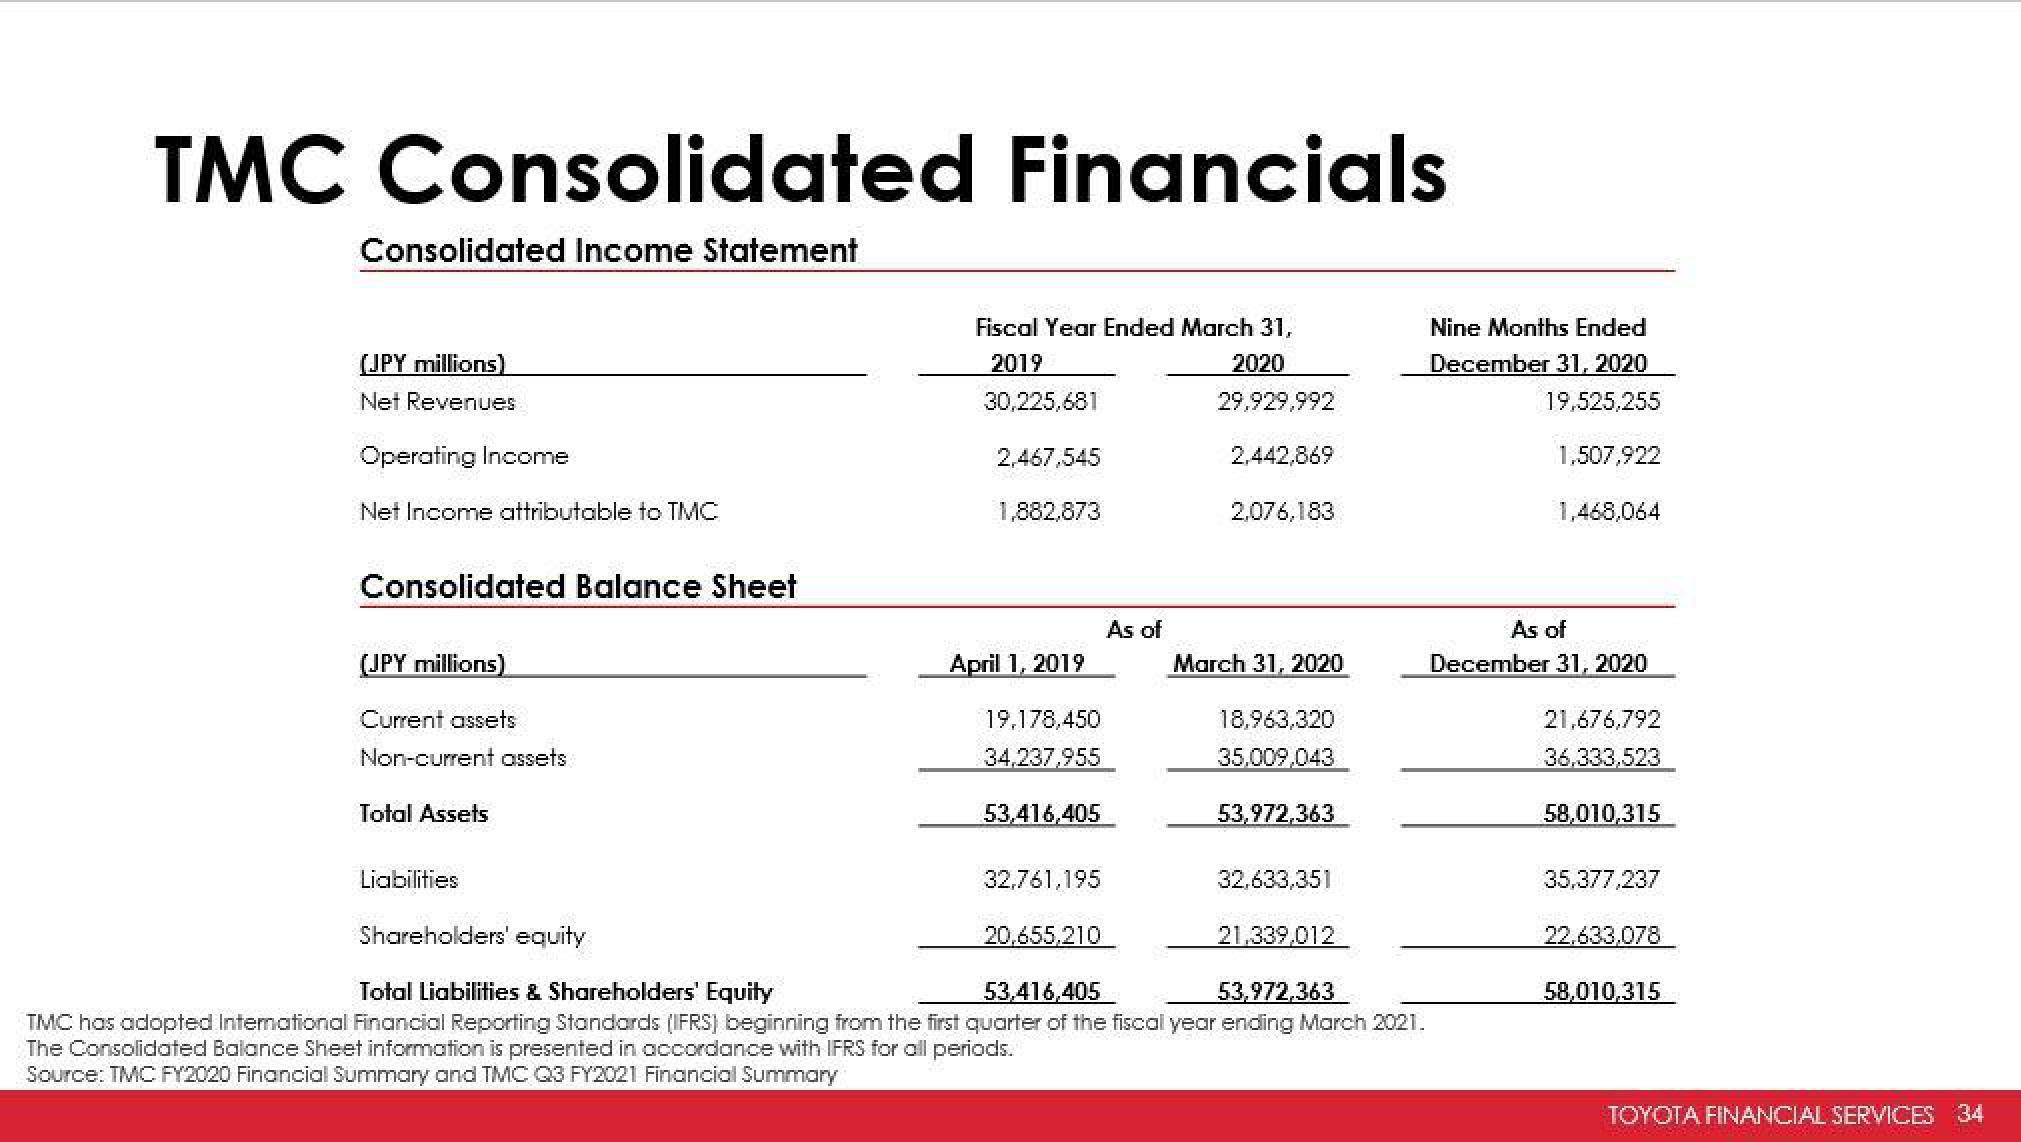
TMC Consolidated Financials
Consolidated Income Statement
(JPY millions)
Net Revenues
Operating Income
Net Income attributable to TMC
Consolidated Balance Sheet
(JPY millions)
Current assets
Non-current assets
Total Assets
Liabilities
Fiscal Year Ended March 31,
2019
2020
30,225,681
2,467,545
1,882,873
April 1, 2019
19,178,450
34,237,955
53,416,405
32,761,195
As of
20,655,210
29,929,992
2,442,869
2,076,183
March 31, 2020
18,963,320
35,009,043
53,972,363
32,633,351
Shareholders' equity
Total Liabilities & Shareholders' Equity
53,416,405
53,972,363
TMC has adopted International Financial Reporting Standards (IFRS) beginning from the first quarter of the fiscal year ending March 2021.
The Consolidated Balance Sheet information is presented in accordance with IFRS for all periods.
Source: TMC FY2020 Financial Summary and TMC Q3 FY2021 Financial Summary
21,339,012
Nine Months Ended
December 31, 2020
19,525,255
1,507,922
1,468,064
As of
December 31, 2020
21,676,792
36,333,523
58,010,315
35.377,237
22,633,078
58,010,315
TOYOTA FINANCIAL SERVICES 34View entire presentation