Capri Holdings Results Presentation Deck
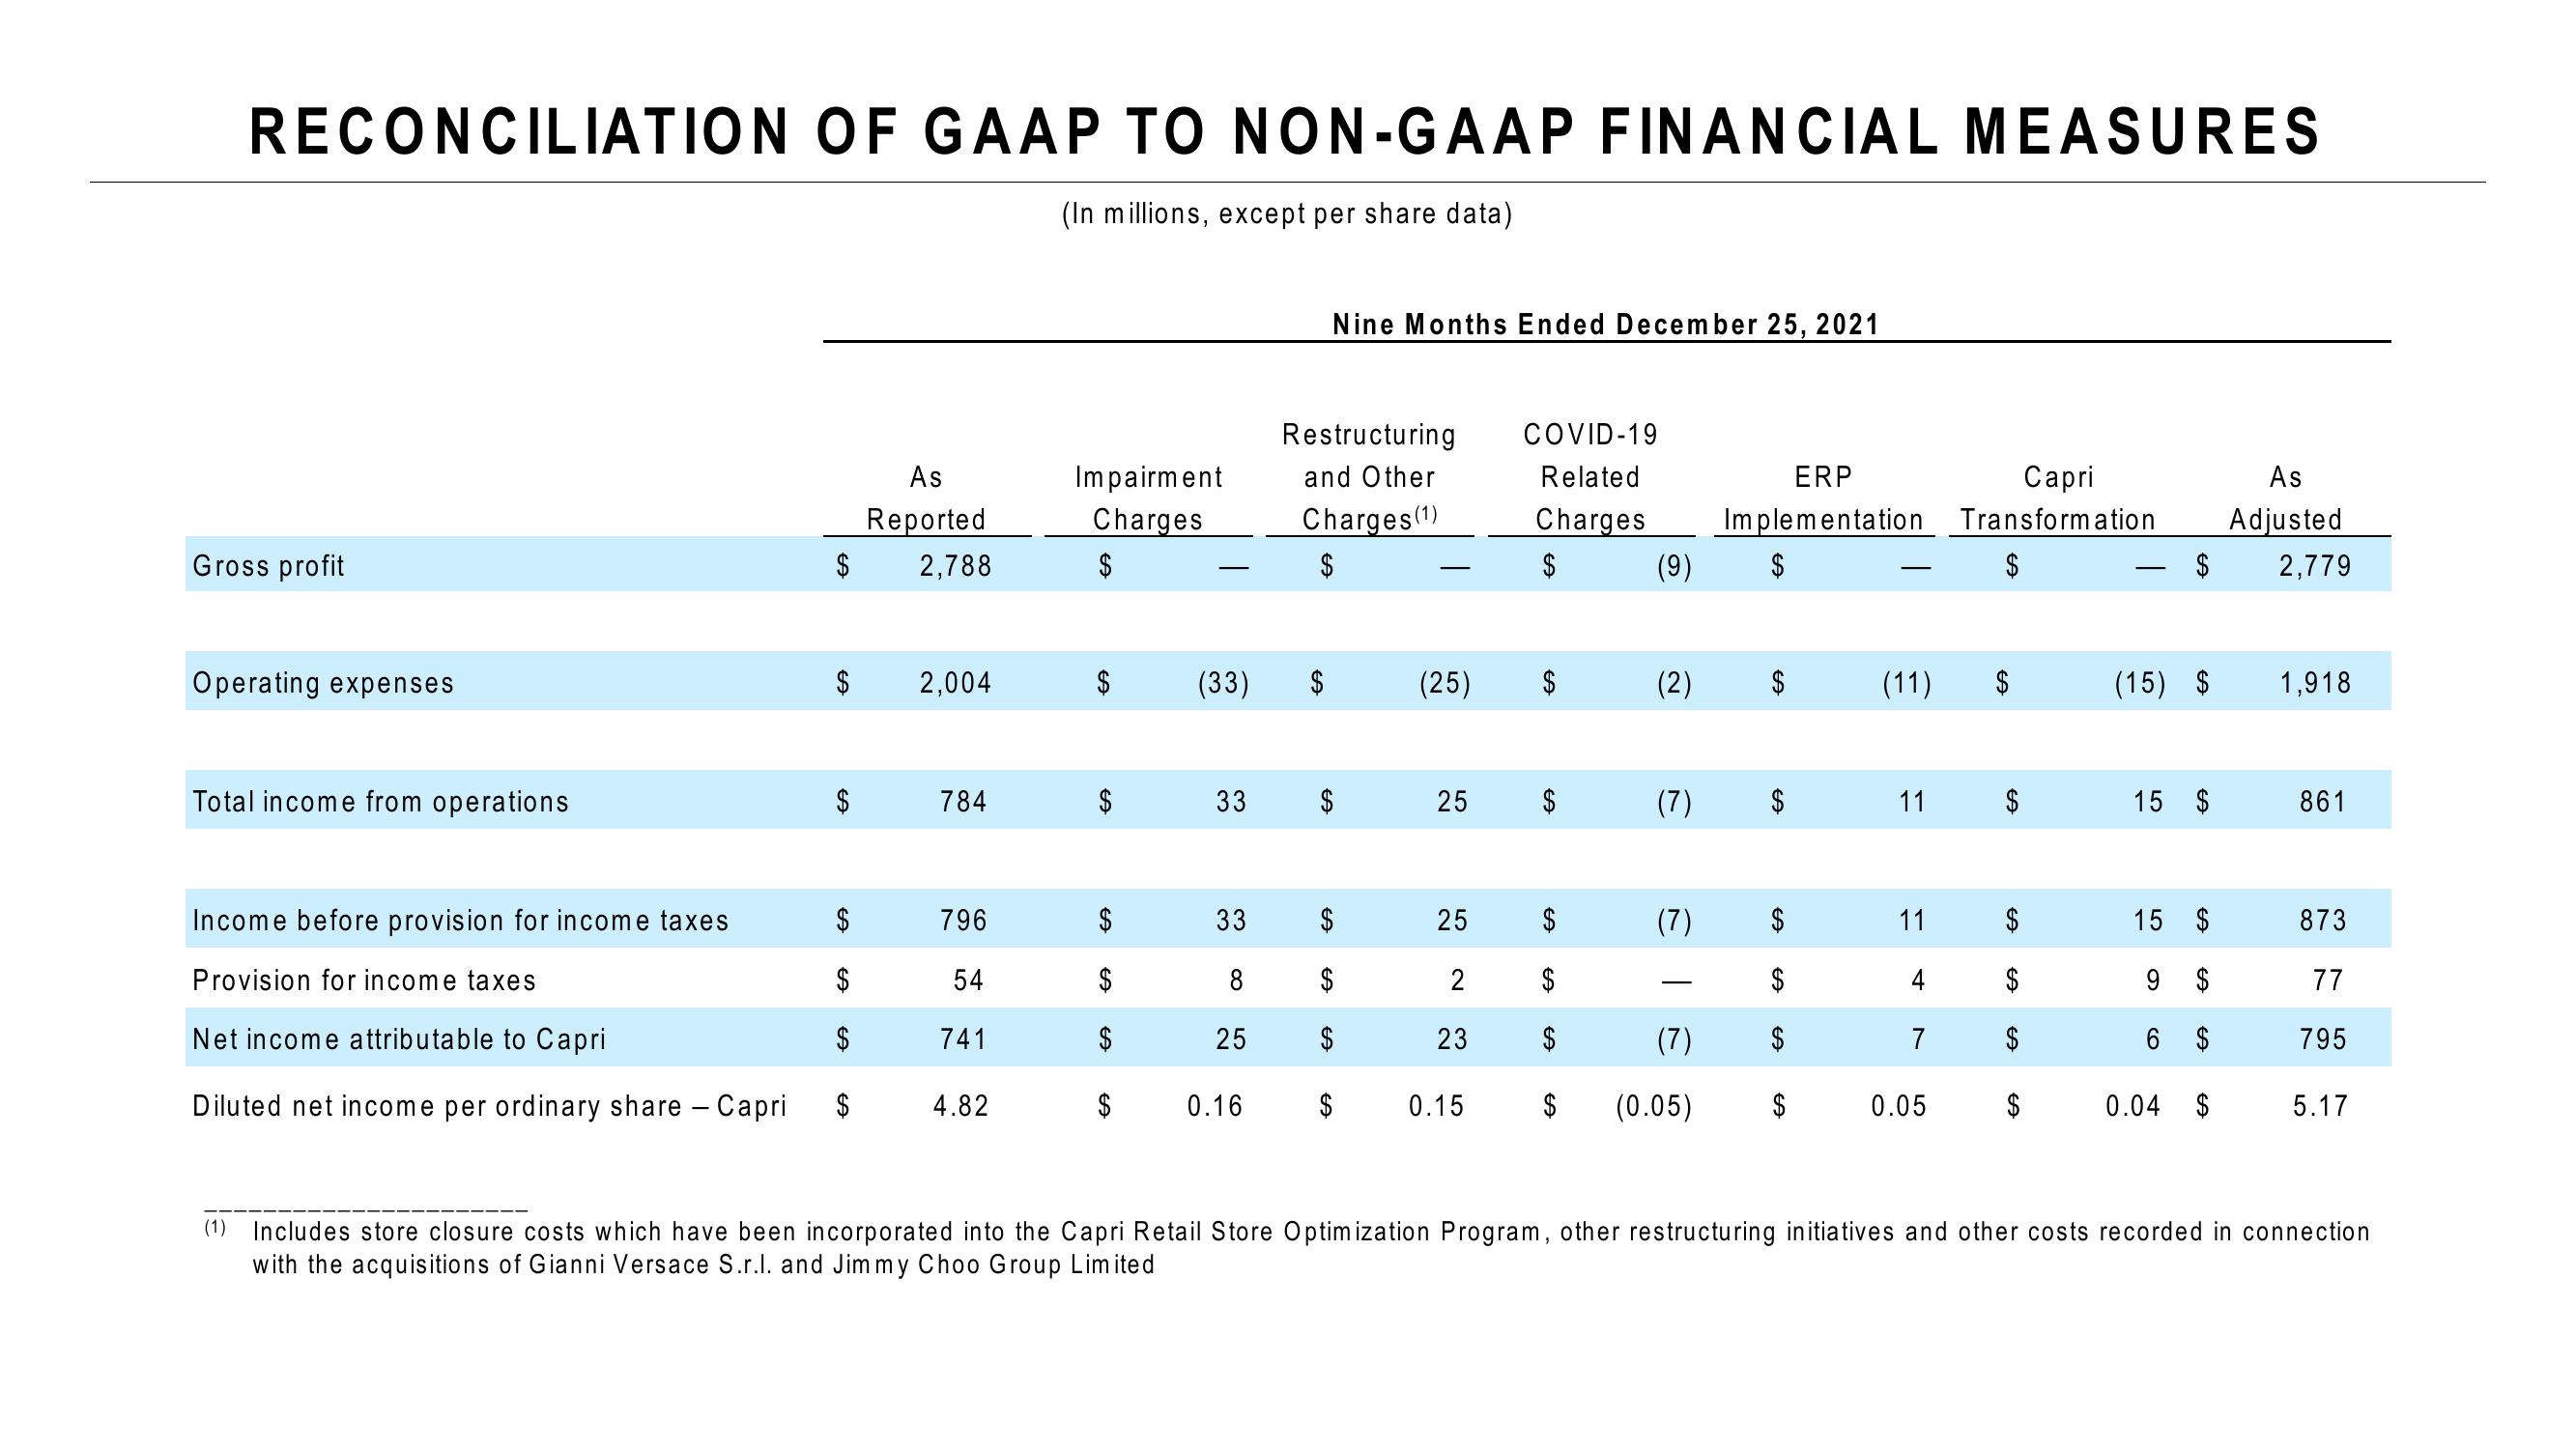
RECONCILIATION OF GAAP TO NON-GAAP FINANCIAL MEASURES
(In millions, except per share data)
Gross profit
Operating expenses
Total income from operations
Income before provision for income taxes
Provision for income taxes
Net income attributable to Capri
Diluted net income per ordinary share - Capri
$
$
EA
$
$
$
As
Reported
2,788
2,004
784
796
54
741
4.82
Impairment
Charges
$
GA
GA
$
$
(33)
33
33
∞
25
0.16
Restructuring
and Other
Charges (1)
$
Nine Months Ended December 25, 2021
SA
SA
SA
SA
(25)
25
25
2
23
0.15
COVID-19
Related
Charges
$
SA
EA
$
(9)
(2)
(7)
(7)
(7)
(0.05)
Capri
ERP
Implementation Transformation
$
$
SA
$
$
(11)
11
11
7
0.05
$
GA
$
$
$
$
(15) $
15 $
15 $
$
6 $
0.04 $
O
As
Adjusted
2,779
1,918
861
873
77
795
5.17
(1) Includes store closure costs which have been incorporated into the Capri Retail Store Optimization Program, other restructuring initiatives and other costs recorded in connection
with the acquisitions of Gianni Versace S.r.l. and Jimmy Choo Group LimitedView entire presentation