Accolade Results Presentation Deck
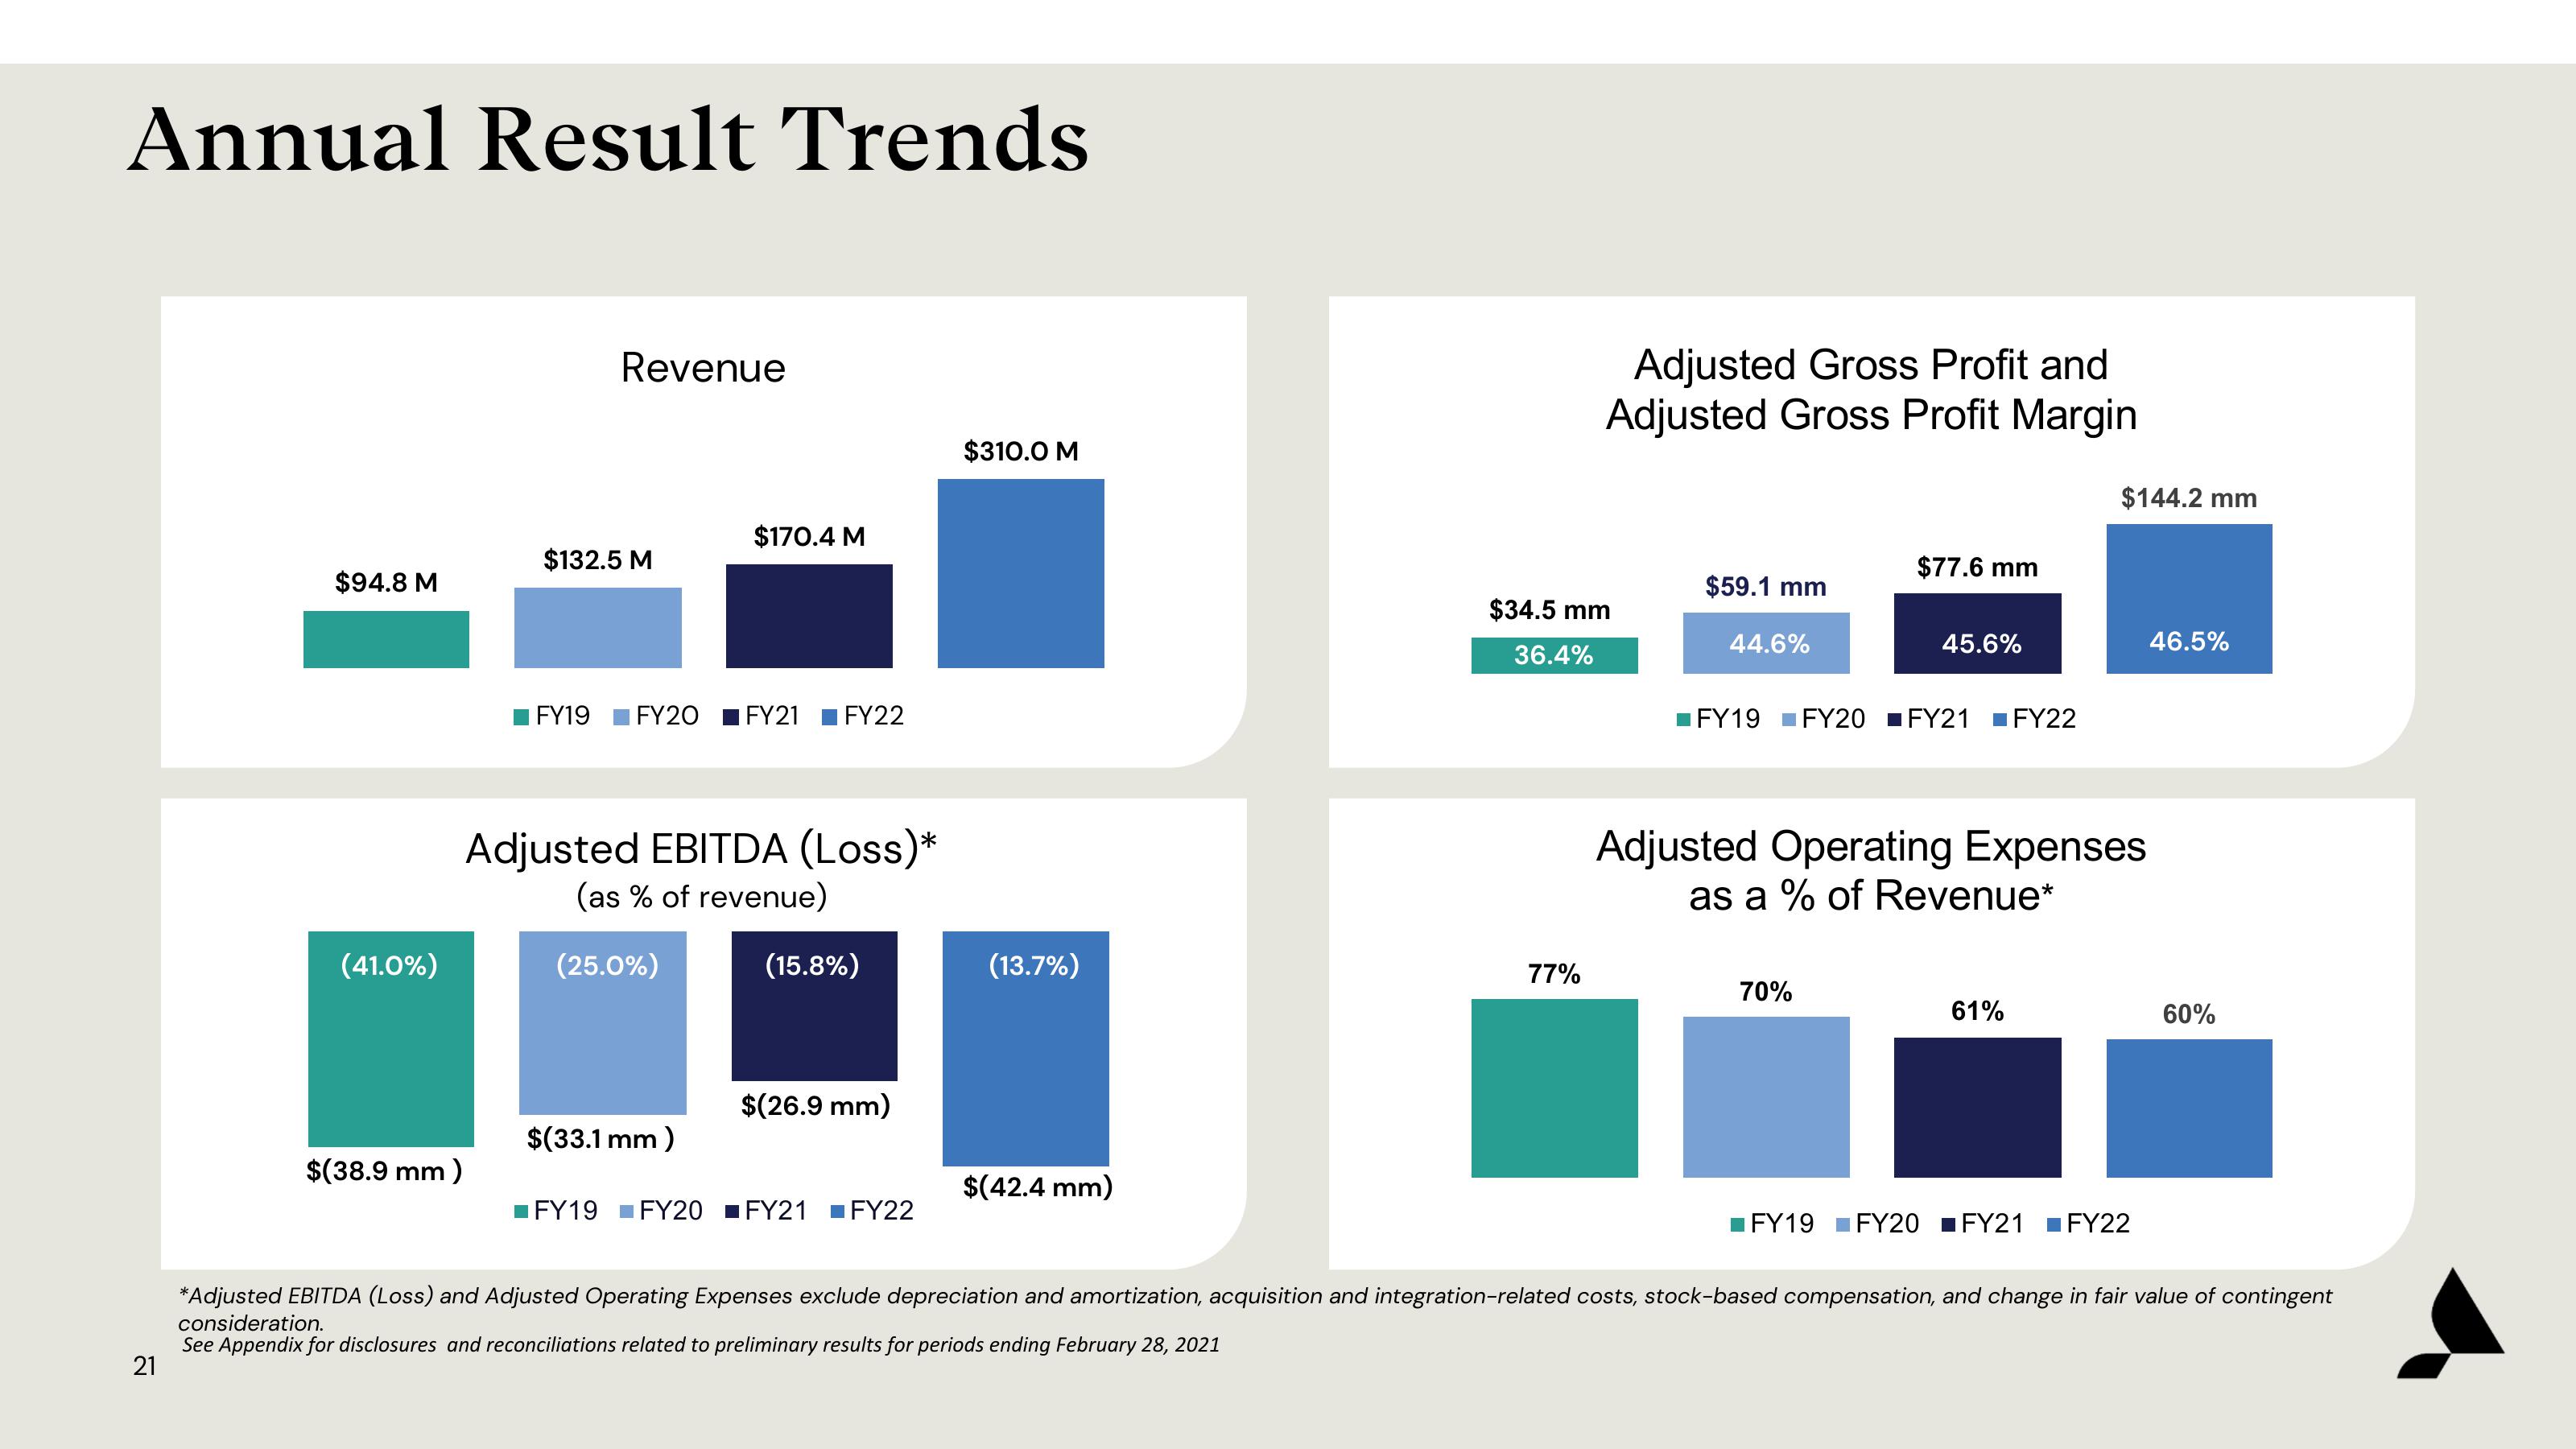
Annual Result Trends
21
$94.8 M
(41.0%)
$(38.9 mm)
Revenue
$132.5 M
$170.4 M
FY19 FY20 FY21 FY22
Adjusted EBITDA (Loss)*
(as % of revenue)
(25.0%)
$(33.1 mm)
(15.8%)
$(26.9 mm)
■FY19 FY20 ■ FY21 ■FY22
$310.0 M
(13.7%)
$(42.4 mm)
Adjusted Gross Profit and
Adjusted Gross Profit Margin
$34.5 mm
36.4%
77%
$59.1 mm
44.6%
$77.6 mm
45.6%
■FY19 FY20 ■ FY21
70%
■FY22
Adjusted Operating Expenses
as a % of Revenue*
$144.2 mm
61%
FY19 FY20 FY21 FY22
46.5%
60%
*Adjusted EBITDA (Loss) and Adjusted Operating Expenses exclude depreciation and amortization, acquisition and integration-related costs, stock-based compensation, and change in fair value of contingent
consideration.
See Appendix for disclosures and reconciliations related to preliminary results for periods ending February 28, 2021View entire presentation