Nexters Results Presentation Deck
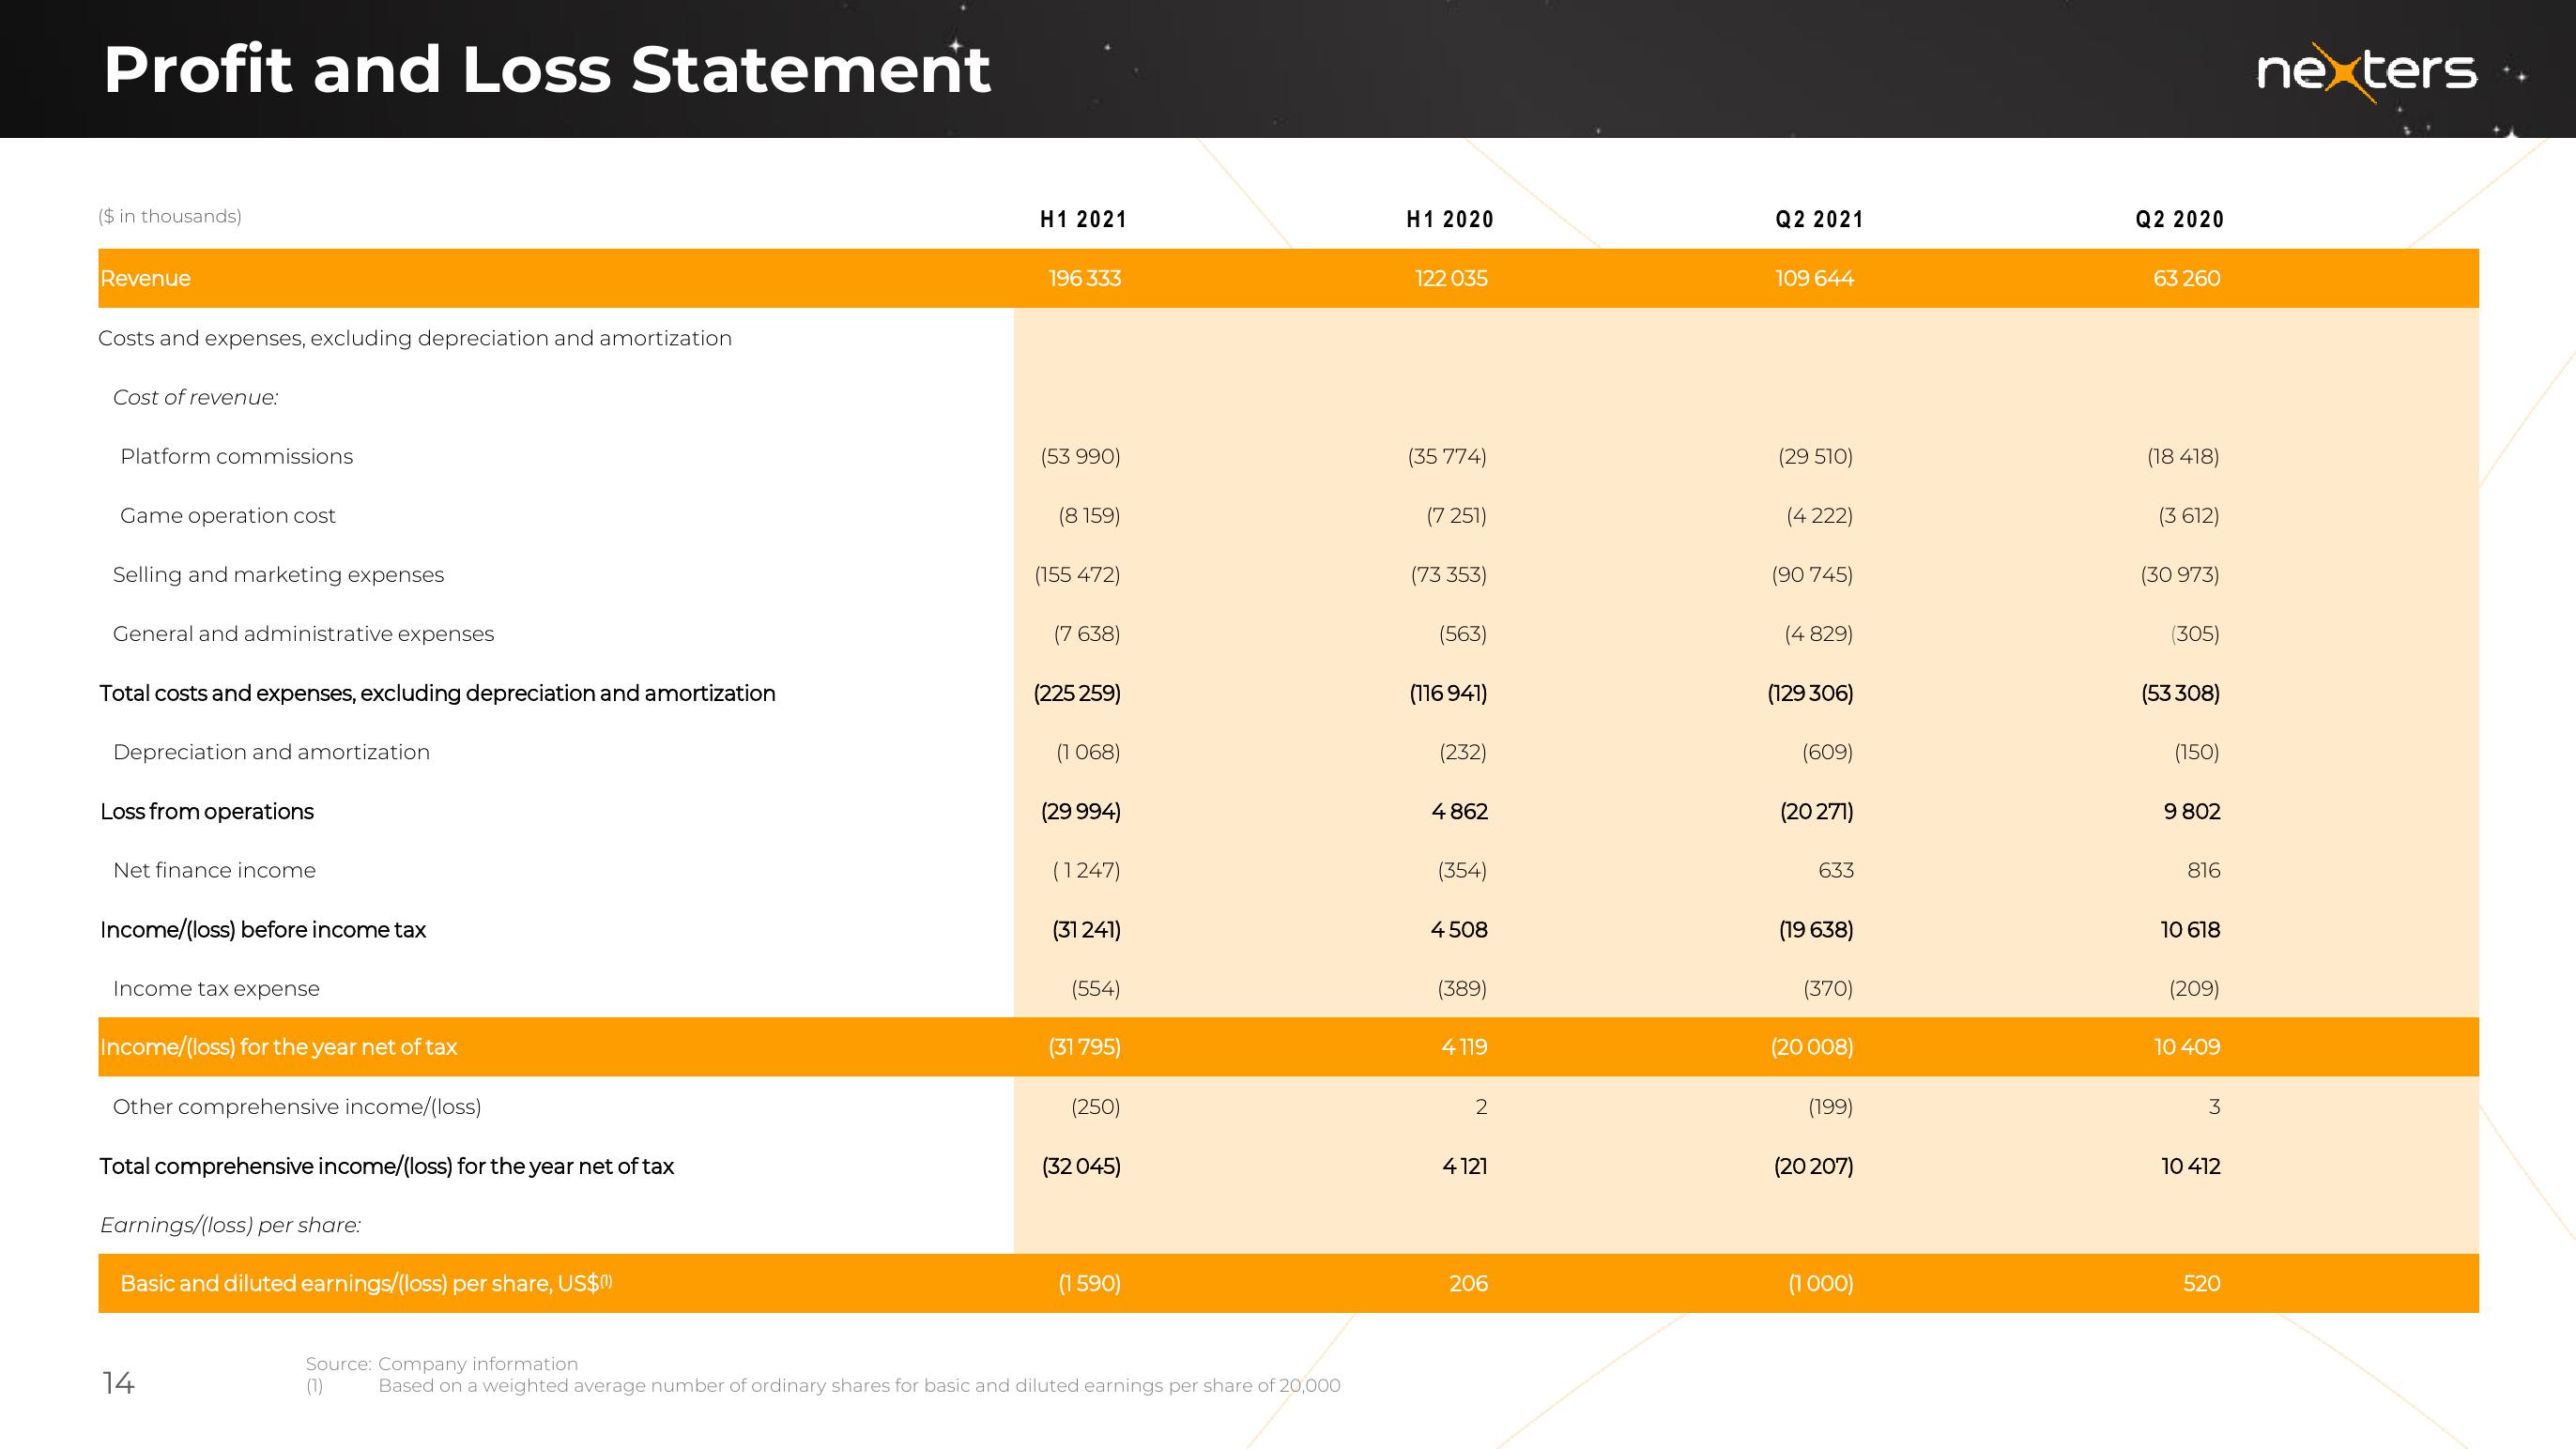
Profit and Loss Statement
($ in thousands)
Revenue
Costs and expenses, excluding depreciation and amortization
Cost of revenue:
Platform commissions
Game operation cost
Selling and marketing expenses
General and administrative expenses
Total costs and expenses, excluding depreciation and amortization
Depreciation and amortization
Loss from operations
Net finance income
Income/(loss) before income tax
Income tax expense
Income/(loss) for the year net of tax
Other comprehensive income/(loss)
Total comprehensive income/(loss) for the year net of tax
Earnings/(loss) per share:
Basic and diluted earnings/(loss) per share, US$)
14
H1 2021
196 333
(53 990)
(8 159)
(155 472)
(7 638)
(225 259)
(1 068)
(29 994)
(1247)
(31 241)
(554)
(31 795)
(250)
(32 045)
(1 590)
Source: Company information
Based on a weighted average number of ordinary shares for basic and diluted earnings per share of 20,000
(1)
H1 2020
122 035
(35 774)
(7 251)
(73 353)
(563)
(116 941)
(232)
4 862
(354)
4508
(389)
4119
2
4121
206
Q2 2021
109 644
(29 510)
(4222)
(90 745)
(4 829)
(129 306)
(609)
(20 271)
633
(19 638)
(370)
(20 008)
(199)
(20 207)
(1000)
Q2 2020
63 260
(18 418)
(3 612)
(30 973)
(305)
(53 308)
(150)
9 802
816
10 618
(209)
10 409
3
10 412
520
nexters.View entire presentation