Baird Investment Banking Pitch Book
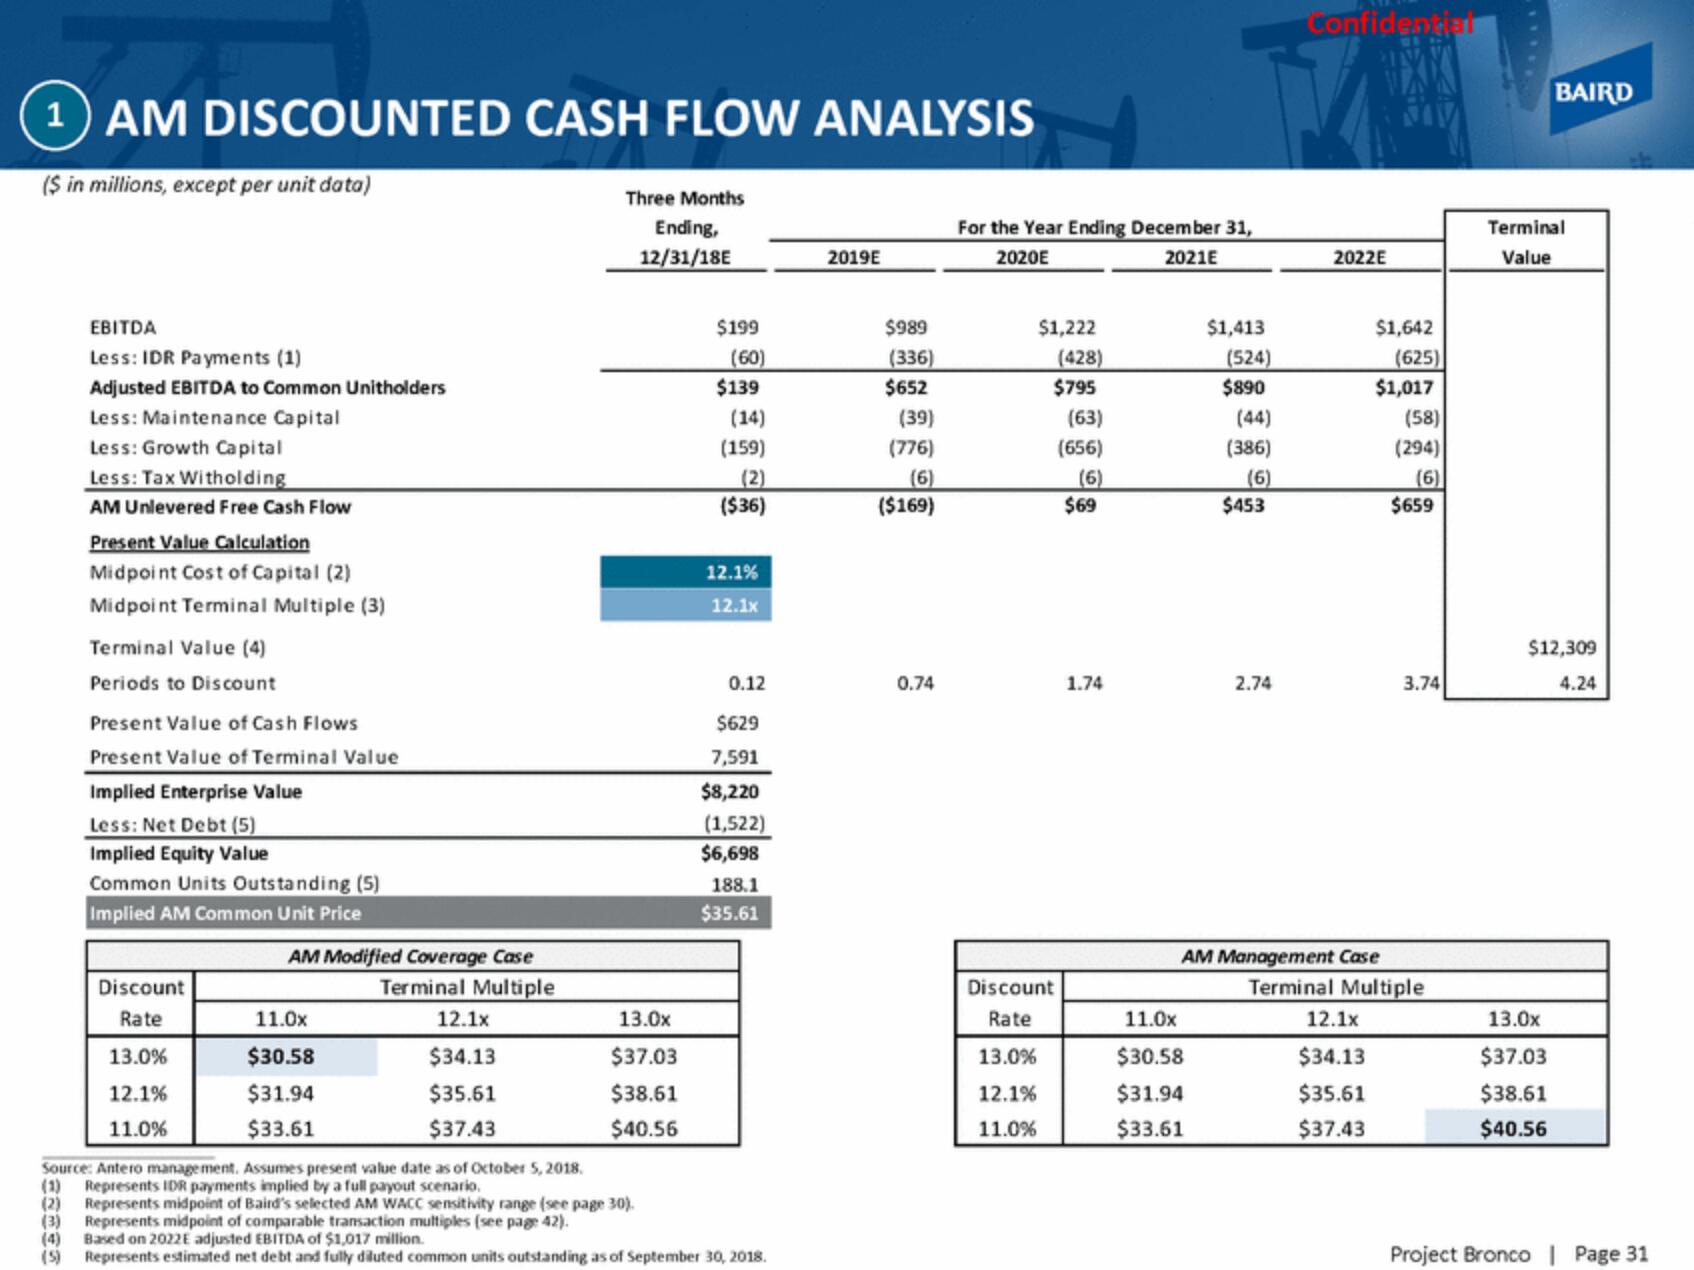
1AM DISCOUNTED CASH FLOW ANALYSIS
($ in millions, except per unit data)
EBITDA
Less: IDR Payments (1)
Adjusted EBITDA to Common Unitholders
Less: Maintenance Capital
Less: Growth Capital
Less: Tax Witholding
AM Unlevered Free Cash Flow
Present Value Calculation
Midpoint Cost of Capital (2)
Midpoint Terminal Multiple (3)
Terminal Value (4)
Periods to Discount
Present Value of Cash Flows
Present Value of Terminal Value
Implied Enterprise Value
Less: Net Debt (5)
Implied Equity Value
Common Units Outstanding (5)
Implied AM Common Unit Price
Discount
Rate
13.0%
12.1%
11.0%
AM Modified Coverage Case
Terminal Multiple
11.0x
$30.58
$31.94
$33.61
12.1x
$34.13
$35.61
$37.43
Three Months
Ending,
12/31/18E
13.0x
$37.03
$38.61
$40.56
$199
(60)
$139
(14)
(159)
(2)
($36)
12.1%
12.1x
0.12
$629
7,591
$8,220
(1,522)
$6,698
188.1
$35.61
Source: Antero management. Assumes present value date as of October 5, 2018.
(1)
Represents IDR payments implied by a full payout scenario.
(2) Represents midpoint of Baird's selected AM WACC sensitivity range (see page 30).
(3)
Represents midpoint of comparable transaction multiples (see page 42).
Based on 2022E adjusted EBITDA of $1,017 million.
(5)
Represents estimated net debt and fully diluted common units outstanding as of September 30, 2018.
2019E
$989
(336)
$652
(39)
(776)
(6)
($169)
0.74
For the Year Ending December 31,
2020E
2021E
$1,222
(428)
$795
Discount
Rate
13.0%
12.1%
11.0%
(63)
(656)
(6)
$69
1.74
$1,413
11.0x
$30.58
$31.94
$33.61
(524)
$890
(44)
(386)
(6)
$453
2.74
Confidential
2022E
$1,642
12.1x
$34.13
$35.61
$37.43
(625)
$1,017
(58)
(294)
(6)
$659
AM Management Case
Terminal Multiple
3.74
BAIRD
Terminal
Value
$12,309
4.24
13.0x
$37.03
$38.61
$40.56
Project Bronco | Page 31View entire presentation