UBS Results Presentation Deck
Non-core and Legacy
USD m, except where indicated
Total revenues
Credit loss expense / (release)
Operating expenses
Profit before tax
RWA (incl. operational risk) (bn)
LRD (bn)
UBS
3Q23
underlying
350
125
1,238
(1,014)
77
156
3Q23
reported
350
125
2,156
(1,932)
77
156
USD bn
RWA
LRD
Operating
expenses
84
209
2Q23
(52)
1.2
77
156
3Q23
3Q23
underlying
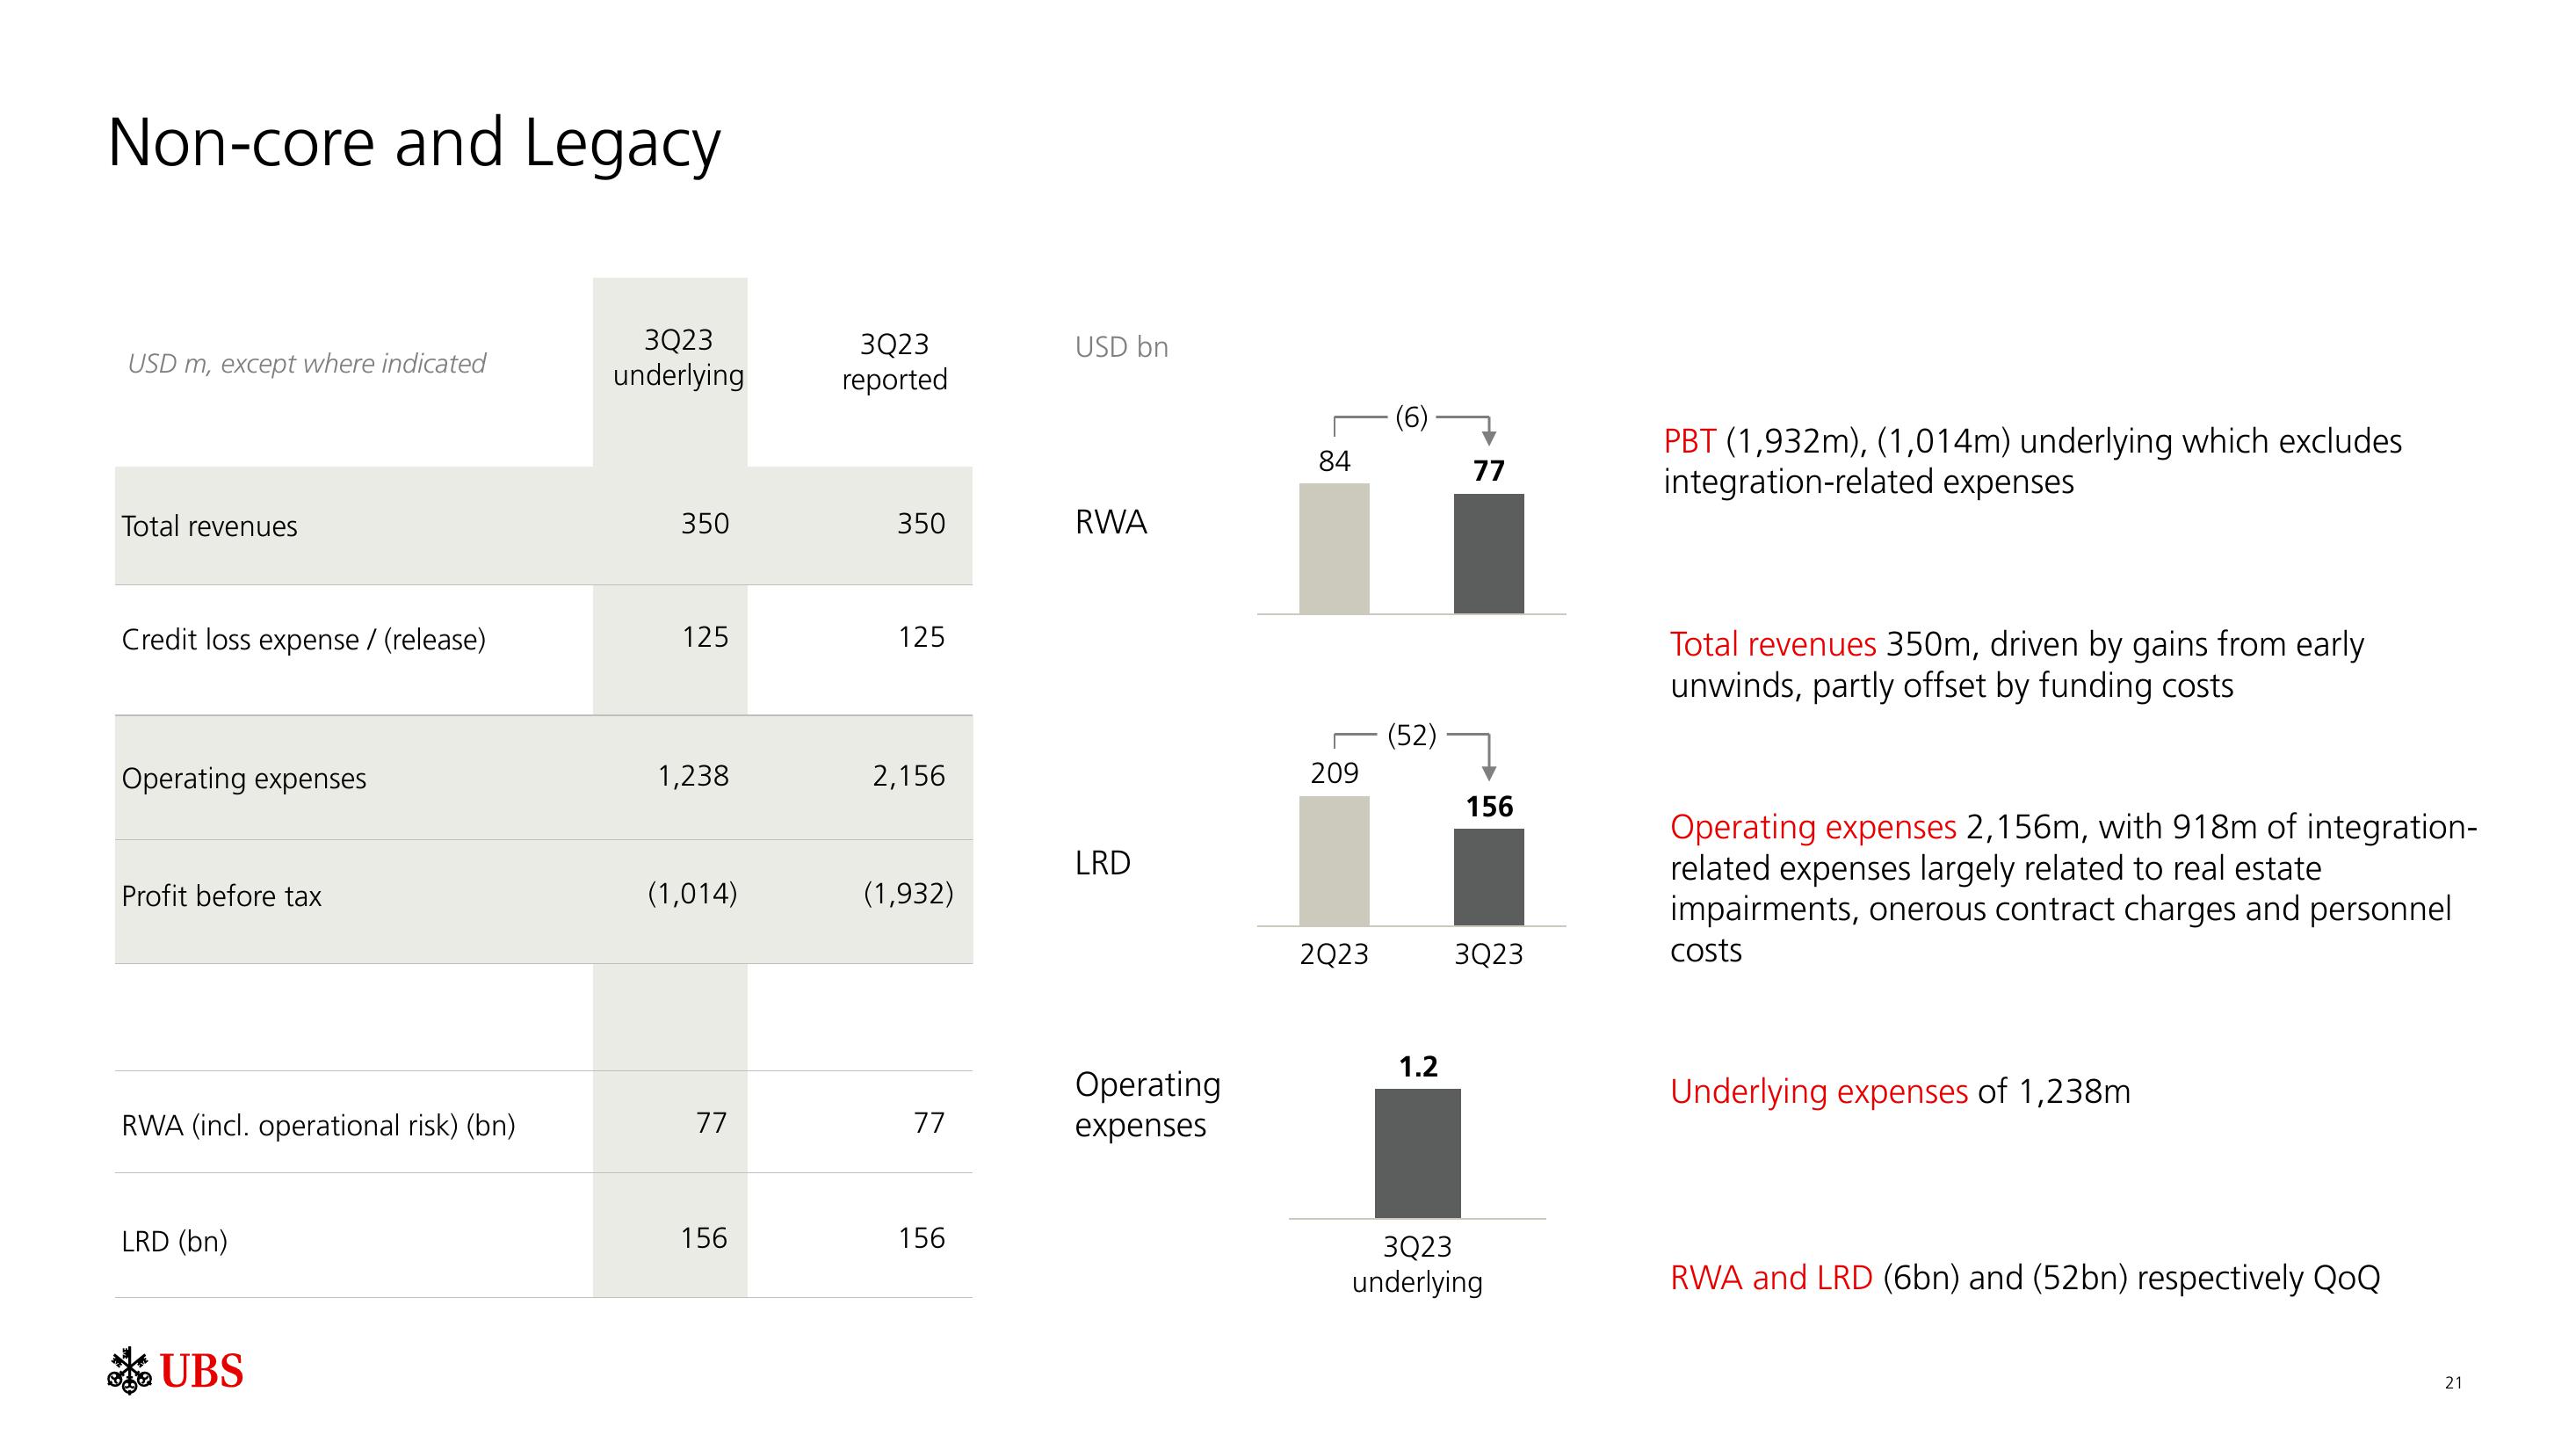
PBT (1,932m), (1,014m) underlying which excludes
integration-related expenses
Total revenues 350m, driven by gains from early
unwinds, partly offset by funding costs
Operating expenses 2,156m, with 918m of integration-
related expenses largely related to real estate
impairments, onerous contract charges and personnel
costs
Underlying expenses of 1,238m
RWA and LRD (6bn) and (52bn) respectively QoQ
21View entire presentation