First Merchants Investor Presentation Deck
Noninterest Income Highlights
3Q23 Noninterest Income Detail ($M)
Gain on
Sale of Loans
$5.5
18%
Service Charges
$8.0
26%
$27.8M
Total
Wealth
Management
$7.4
24%
Card
Payment Fees
$4.7
15%
Other
$1.2
4%
Gain (Loss) on
Sale of Securities
($1.7)
-5%
Derivative
Hedge Fees
$0.5
BOLI 1%
$1.8
6%
Other
Customer Fees
$0.4
1%
Highlights
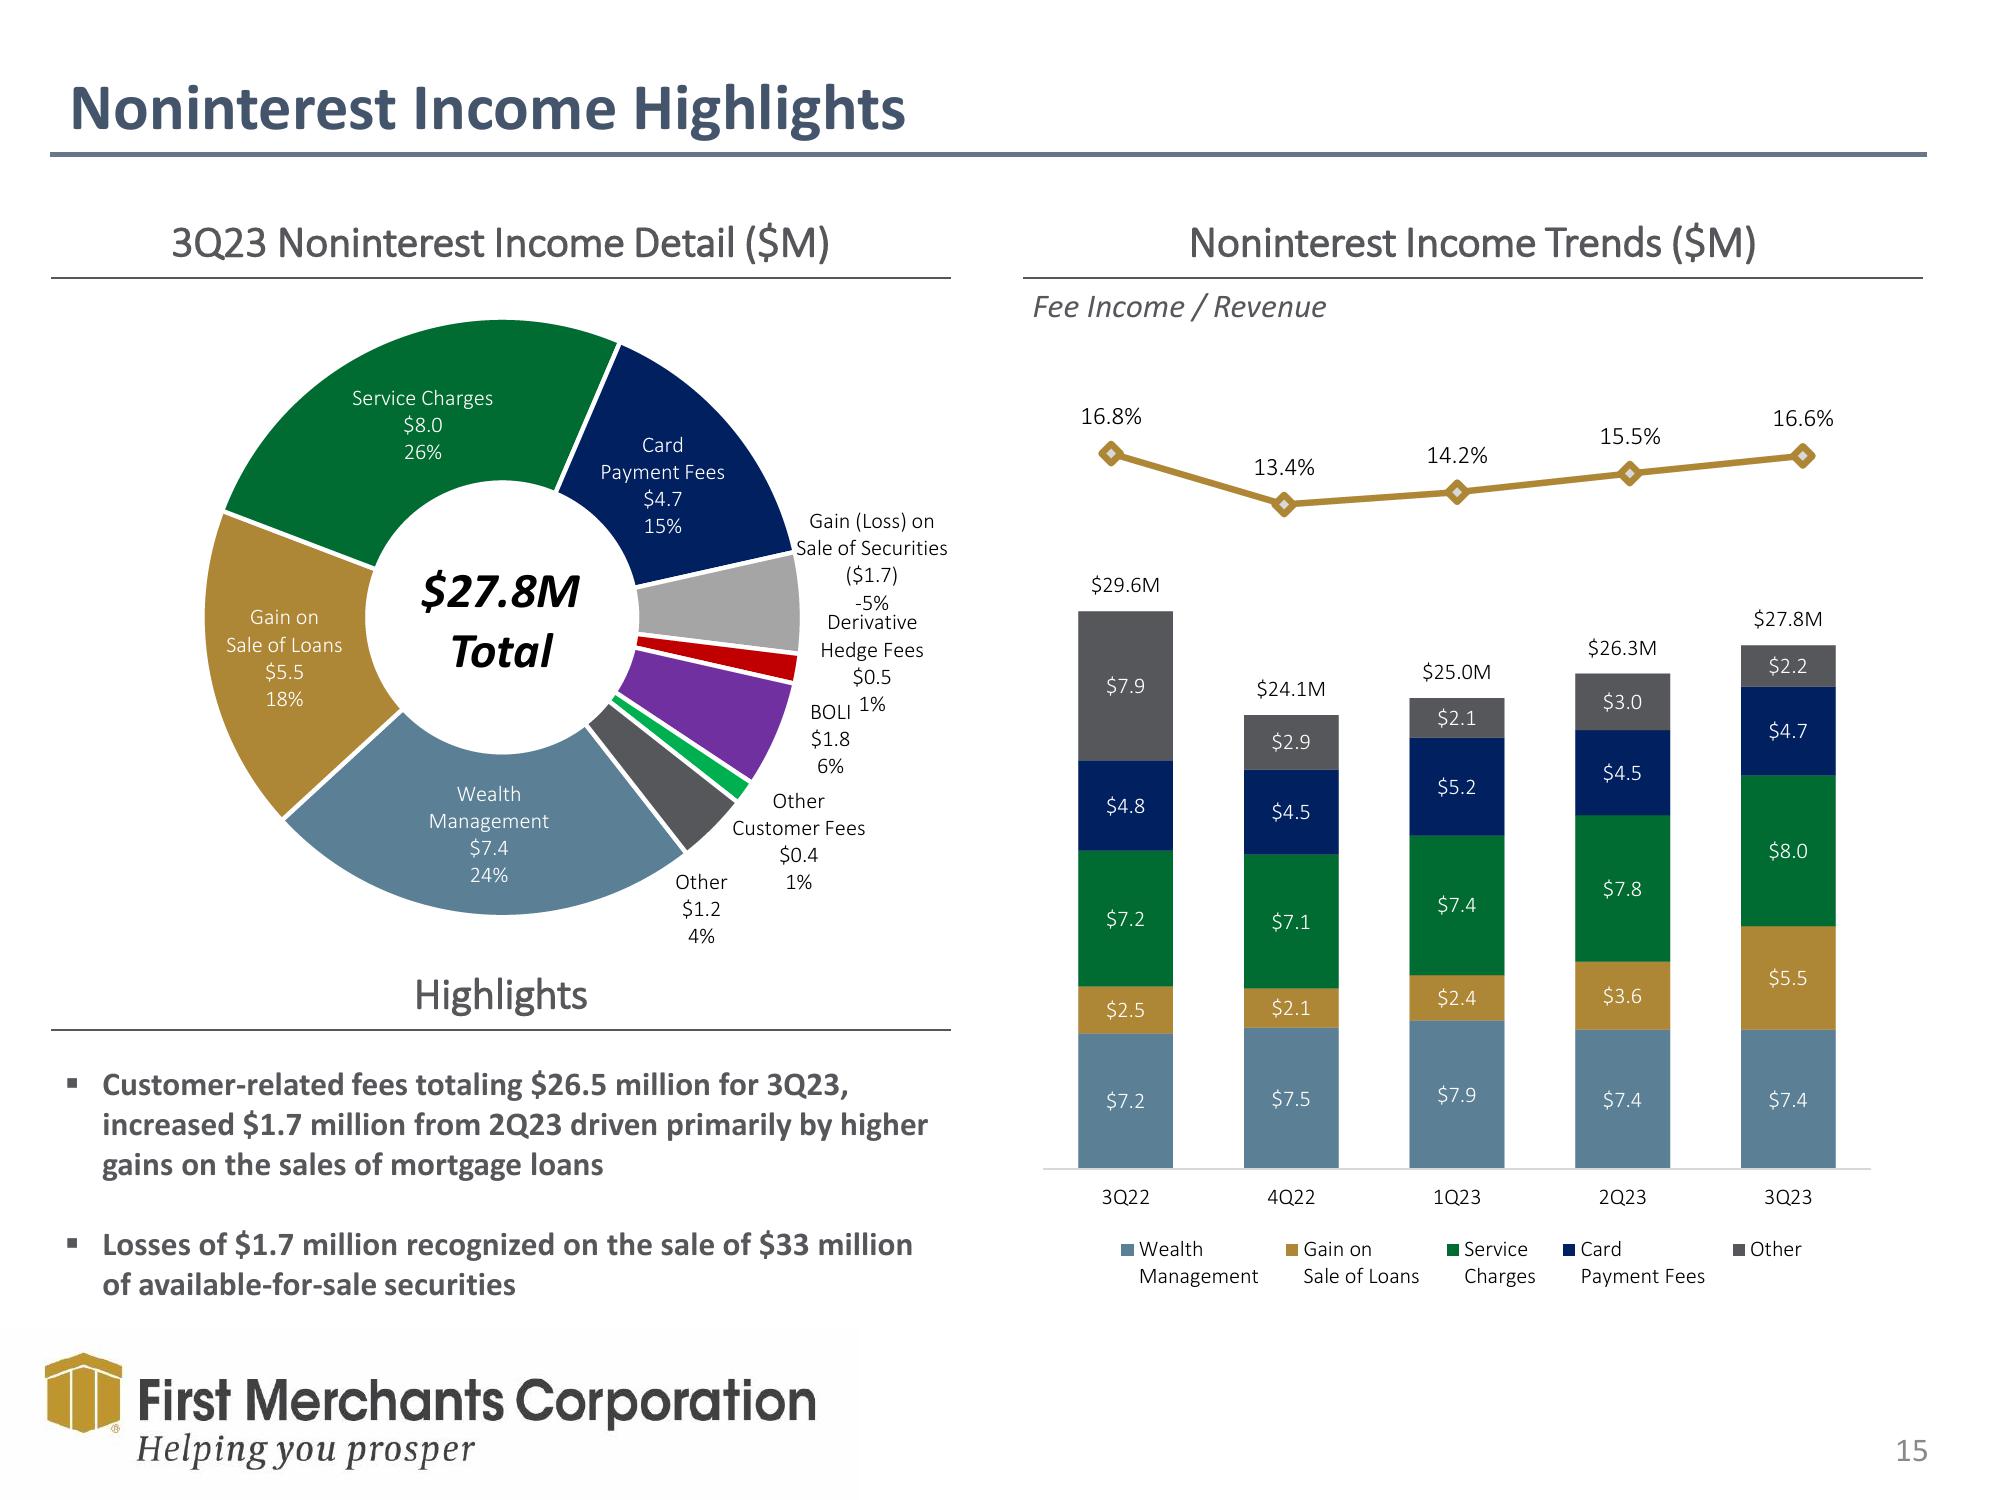
▪ Customer-related fees totaling $26.5 million for 3Q23,
increased $1.7 million from 2Q23 driven primarily by higher
gains on the sales of mortgage loans
First Merchants Corporation
Helping you prosper
▪ Losses of $1.7 million recognized on the sale of $33 million
of available-for-sale securities
Fee Income / Revenue
16.8%
$29.6M
$7.9
$4.8
$7.2
$2.5
$7.2
Noninterest Income Trends ($M)
3Q22
13.4%
$24.1M
Wealth
Management
$2.9
$4.5
$7.1
$2.1
$7.5
4Q22
Gain on
Sale of Loans
14.2%
$25.0M
$2.1
$5.2
$7.4
$2.4
$7.9
1Q23
Service
Charges
15.5%
$26.3M
$3.0
$4.5
$7.8
$3.6
$7.4
2Q23
■ Card
Payment Fees
16.6%
$27.8M
$2.2
$4.7
$8.0
$5.5
$7.4
3Q23
■Other
15View entire presentation