Xos SPAC Presentation Deck
Volume/Revenue Forecast: Growing Product and Geographic Diversification
PRODUCTION VOLUME (BY VEHICLE TYPE)
% TAM¹
(1)
0.0%
2023
17
0.0%
0.2%
2022-25 CAGR
154.8%
116
2,007
1.0%
8,715
2.4%
20,427
3.9%
33,674
2020E 2021E 2022E 2023E 2024E 2025E
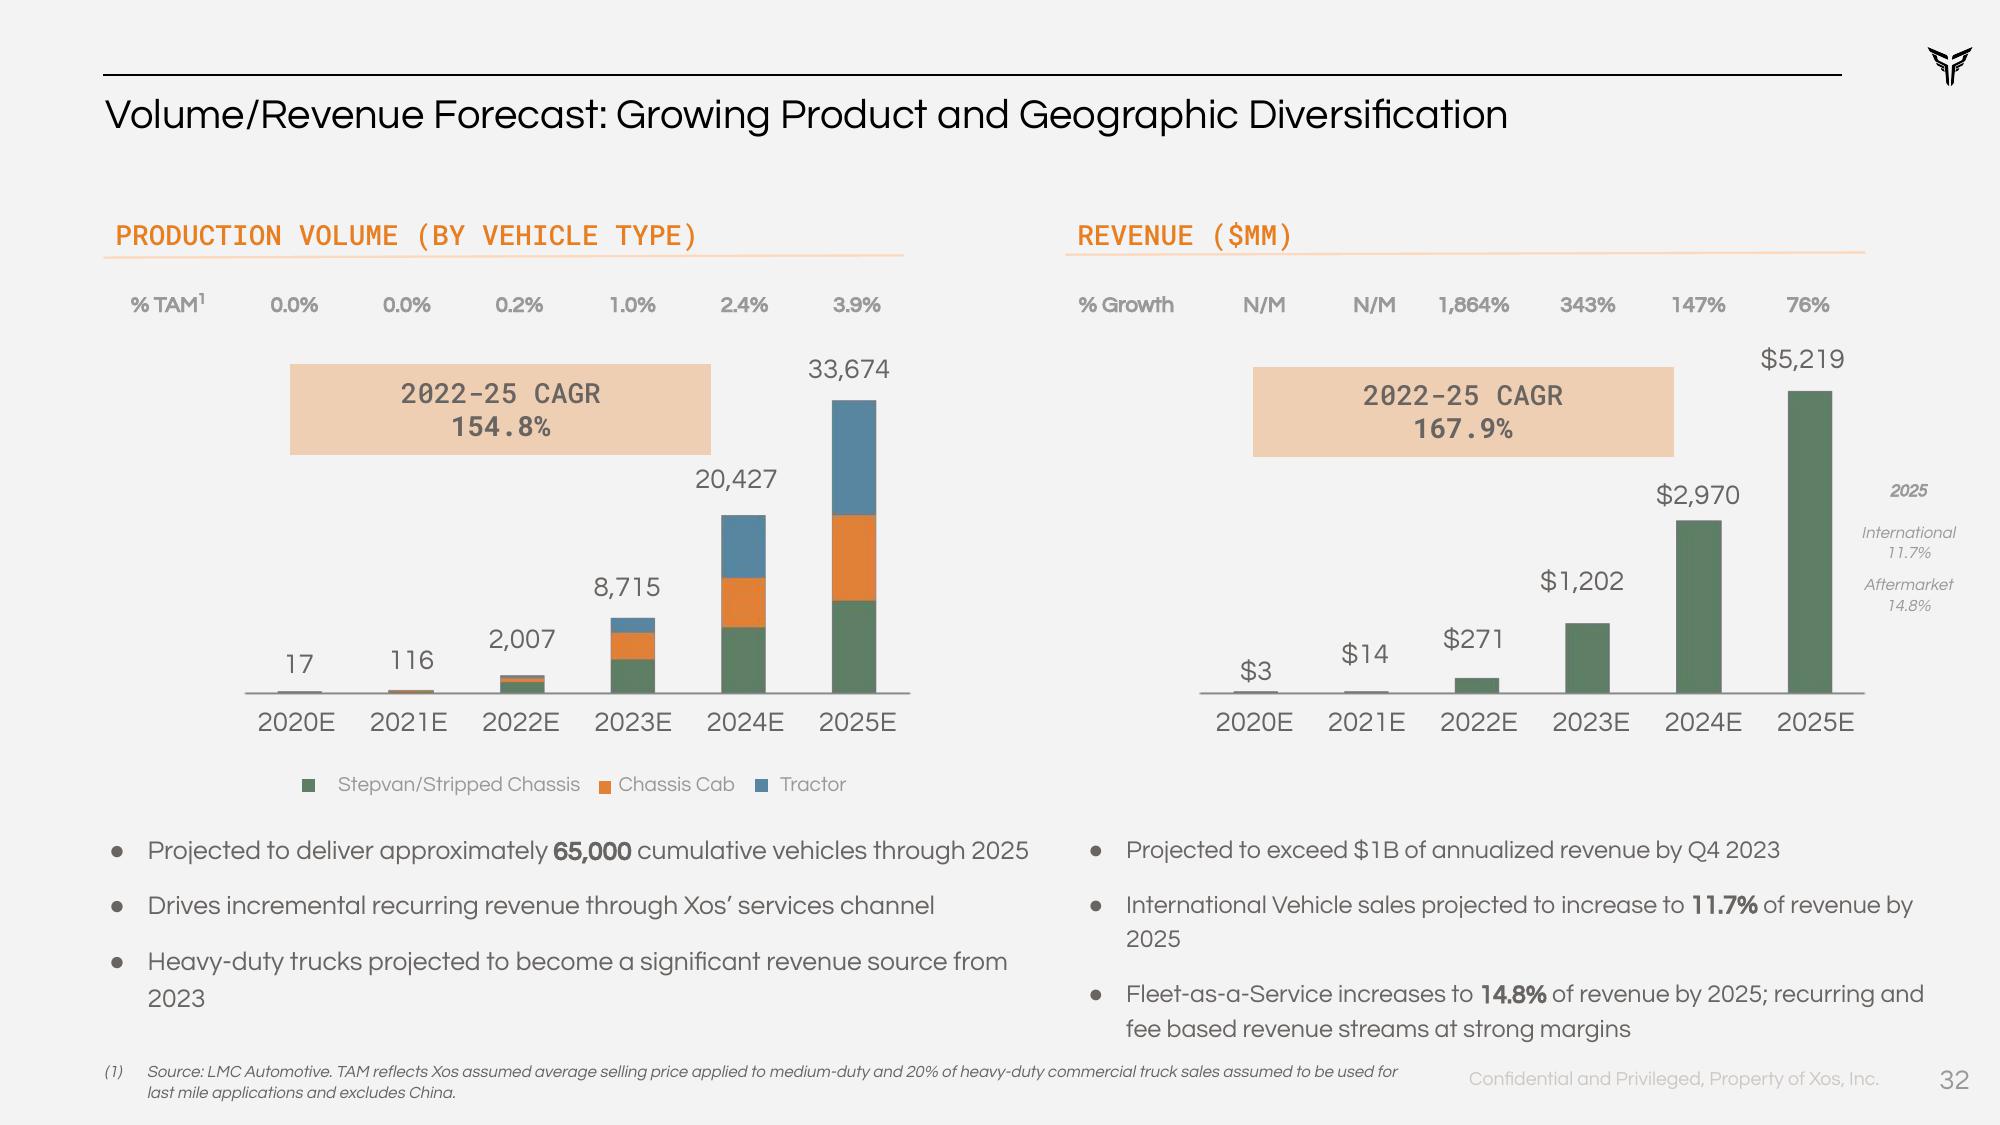
• Projected to deliver approximately 65,000 cumulative vehicles through 2025
● Drives incremental recurring revenue through Xos' services channel
• Heavy-duty trucks projected to become a significant revenue source from
Stepvan/Stripped Chassis Chassis Cab Tractor
REVENUE (SMM)
% Growth
●
N/M
2025
$3
2020E
N/M 1,864%
2022-25 CAGR
167.9%
$14
2021E
343%
$271
Source: LMC Automotive. TAM reflects Xos assumed average selling price applied to medium-duty and 20% of heavy-duty commercial truck sales assumed to be used for
last mile applications and excludes China.
$1,202
147%
$2,970
76%
$5,219
2022E 2023E 2024E 2025E
2025
● Projected to exceed $1B of annualized revenue by Q4 2023
International Vehicle sales projected to increase to 11.7% of revenue by
International
11.7%
Aftermarket
14.8%
Fleet-as-a-Service increases to 14.8% of revenue by 2025; recurring and
fee based revenue streams at strong margins
Confidential and Privileged, Property of Xos, Inc.
32View entire presentation