Bed Bath & Beyond Results Presentation Deck
Q4 key performance metrics
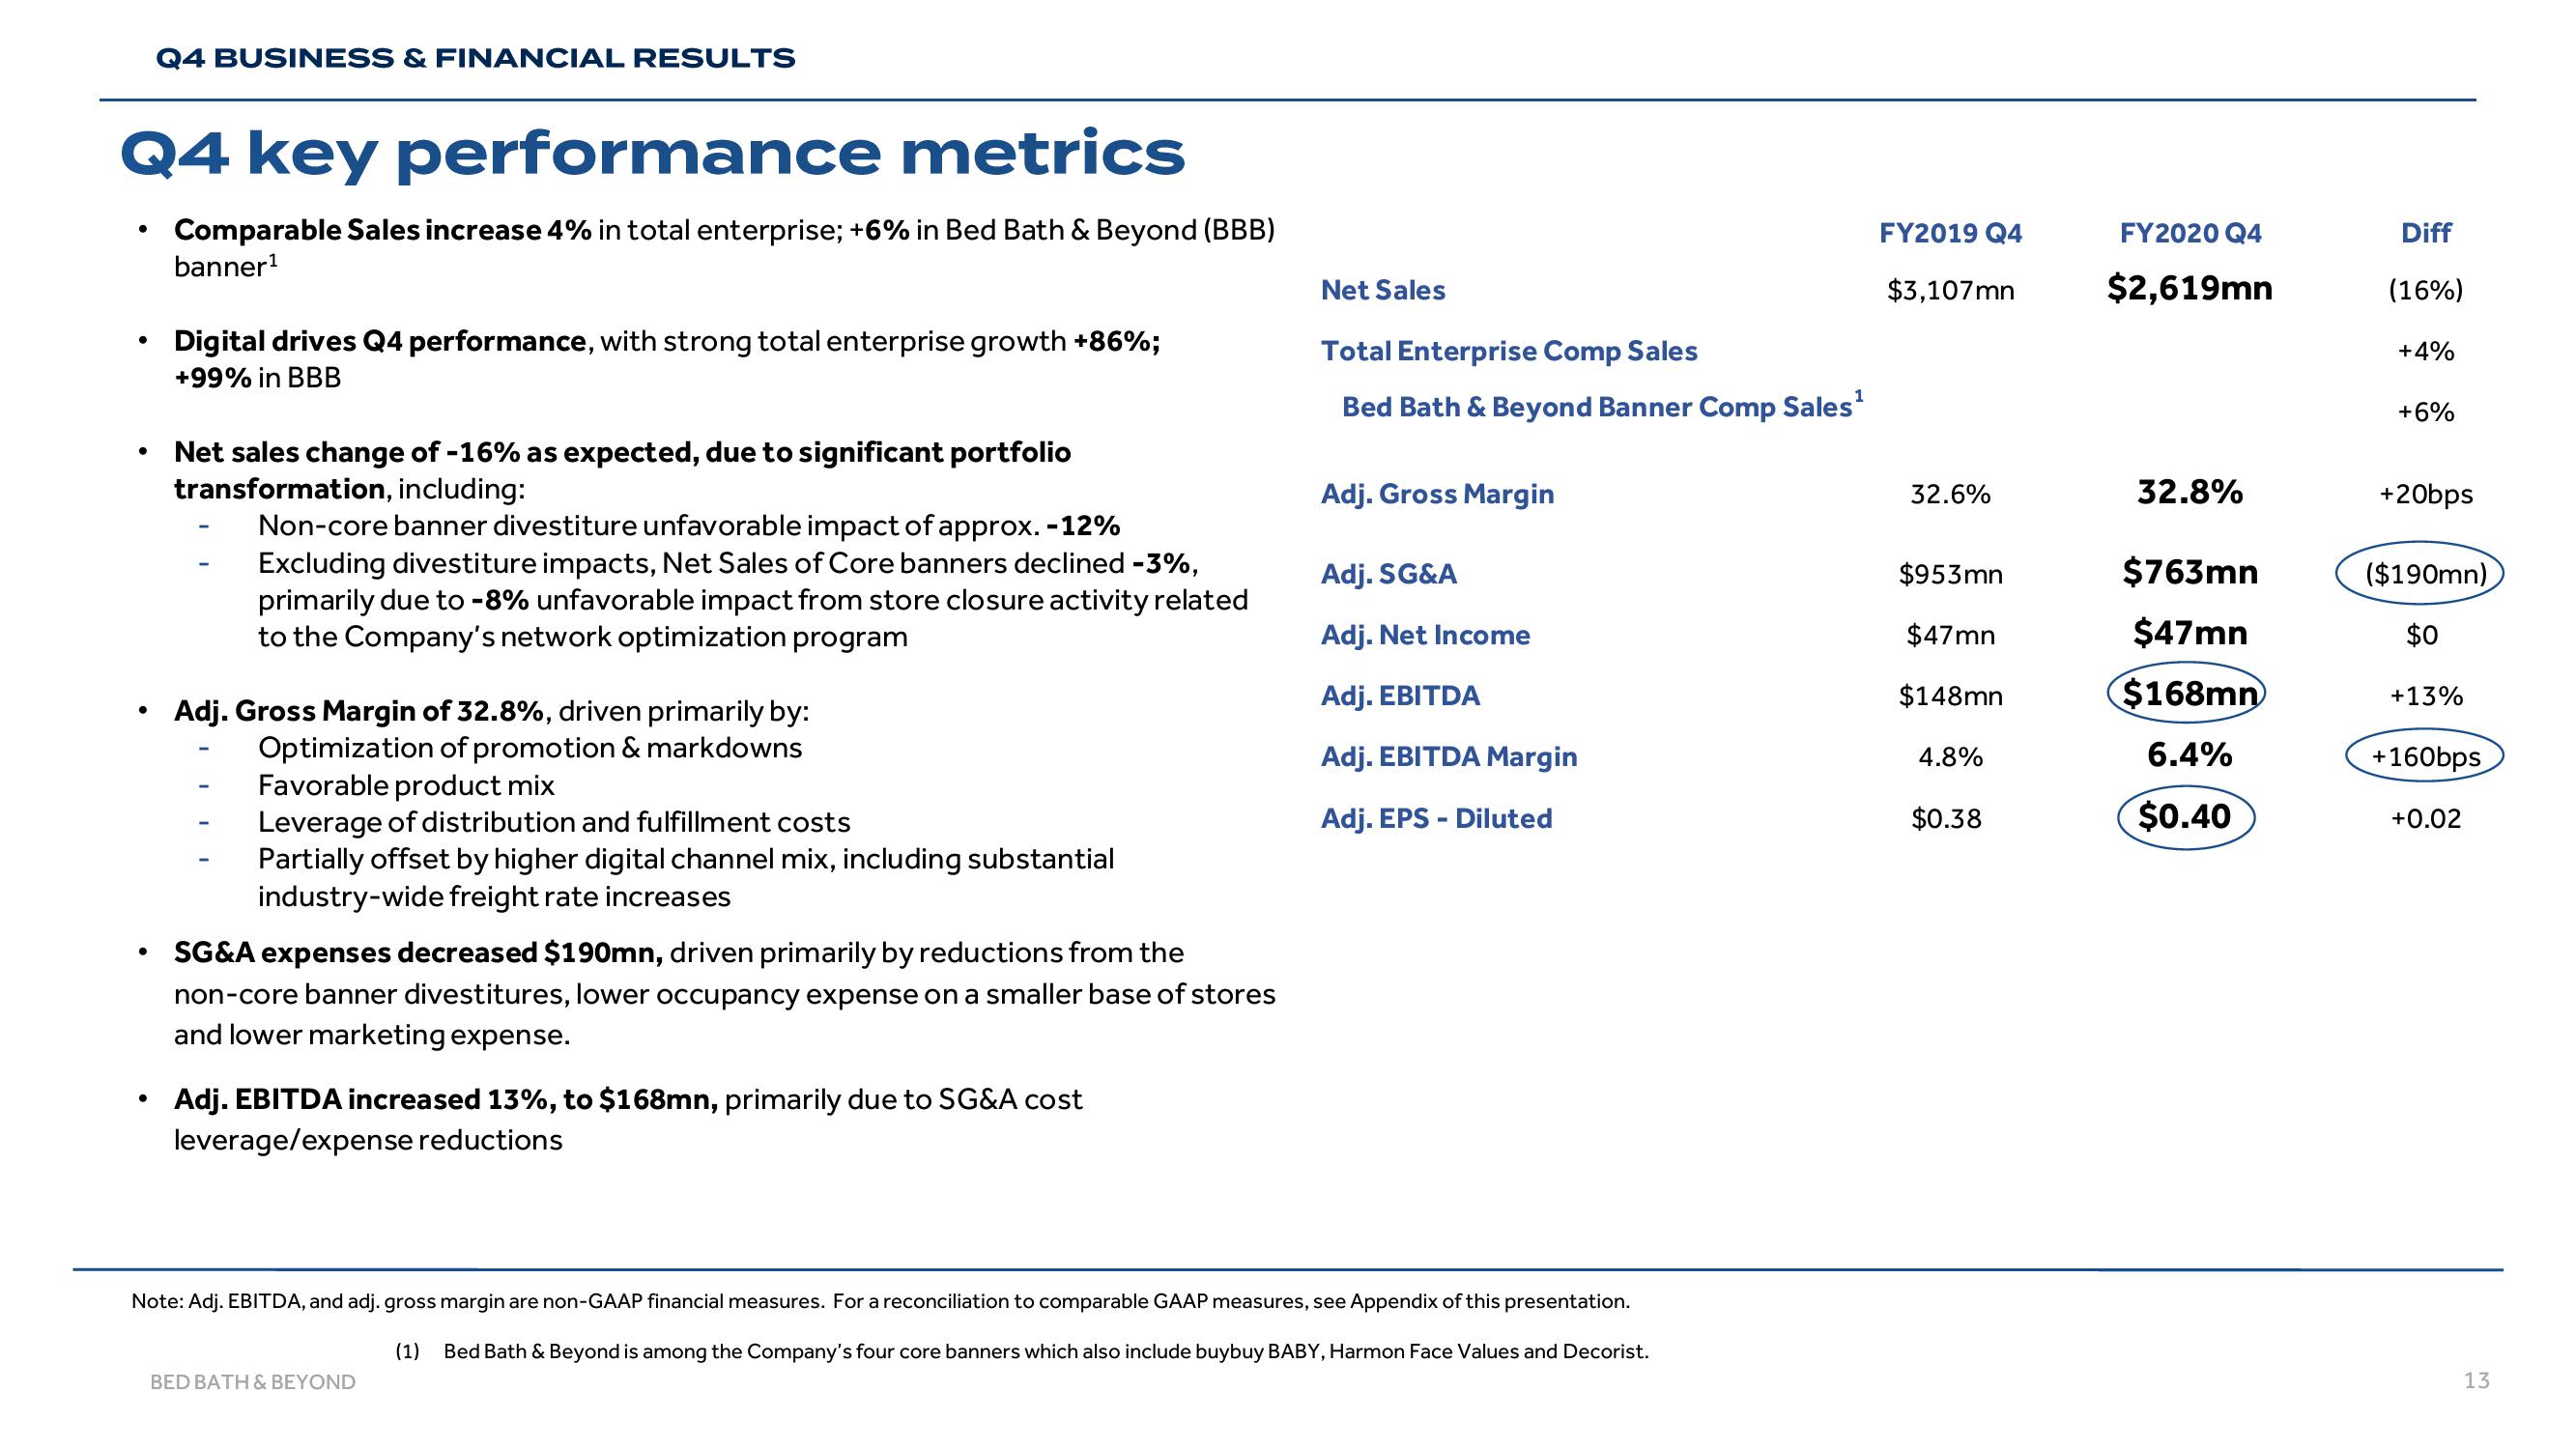
Comparable Sales increase 4% in total enterprise; +6% in Bed Bath & Beyond (BBB)
banner¹
●
●
Q4 BUSINESS & FINANCIAL RESULTS
●
Digital drives Q4 performance, with strong total enterprise growth +86%;
+99% in BBB
Net sales change of -16% as expected, due to significant portfolio
transformation, including:
Non-core banner divestiture unfavorable impact of approx. -12%
Excluding divestiture impacts, Net Sales of Core banners declined -3%,
primarily due to -8% unfavorable impact from store closure activity related
to the Company's network optimization program
Adj. Gross Margin of 32.8%, driven primarily by:
Optimization of promotion & markdowns
Favorable product mix
Leverage of distribution and fulfillment costs
Partially offset by higher digital channel mix, including substantial
industry-wide freight rate increases
SG&A expenses decreased $190mn, driven primarily by reductions from the
non-core banner divestitures, lower occupancy expense on a smaller base of stores
and lower marketing expense.
Adj. EBITDA increased 13%, to $168mn, primarily due to SG&A cost
leverage/expense reductions
Net Sales
BED BATH & BEYOND
Total Enterprise Comp Sales
Bed Bath & Beyond Banner Comp Sales¹
Adj. Gross Margin
Adj. SG&A
Adj. Net Income
Adj. EBITDA
Adj. EBITDA Margin
Adj. EPS - Diluted
Note: Adj. EBITDA, and adj. gross margin are non-GAAP financial measures. For a reconciliation to comparable GAAP measures, see Appendix of this presentation.
(1) Bed Bath & Beyond is among the Company's four core banners which also include buybuy BABY, Harmon Face Values and Decorist.
FY2019 Q4
$3,107mn
32.6%
$953mn
$47mn
$148mn
4.8%
$0.38
FY2020 Q4
$2,619mn
32.8%
$763mn
$47mn
$168mn
6.4%
$0.40
Diff
(16%)
+4%
+6%
+20bps
($190mn)
$0
+13%
+160bps
+0.02
13View entire presentation