Oaktree Real Estate Opportunities Fund VII, L.P.
OAKTREE REAL ESTATE OPPORTUNITIES FUND VII, L.P.
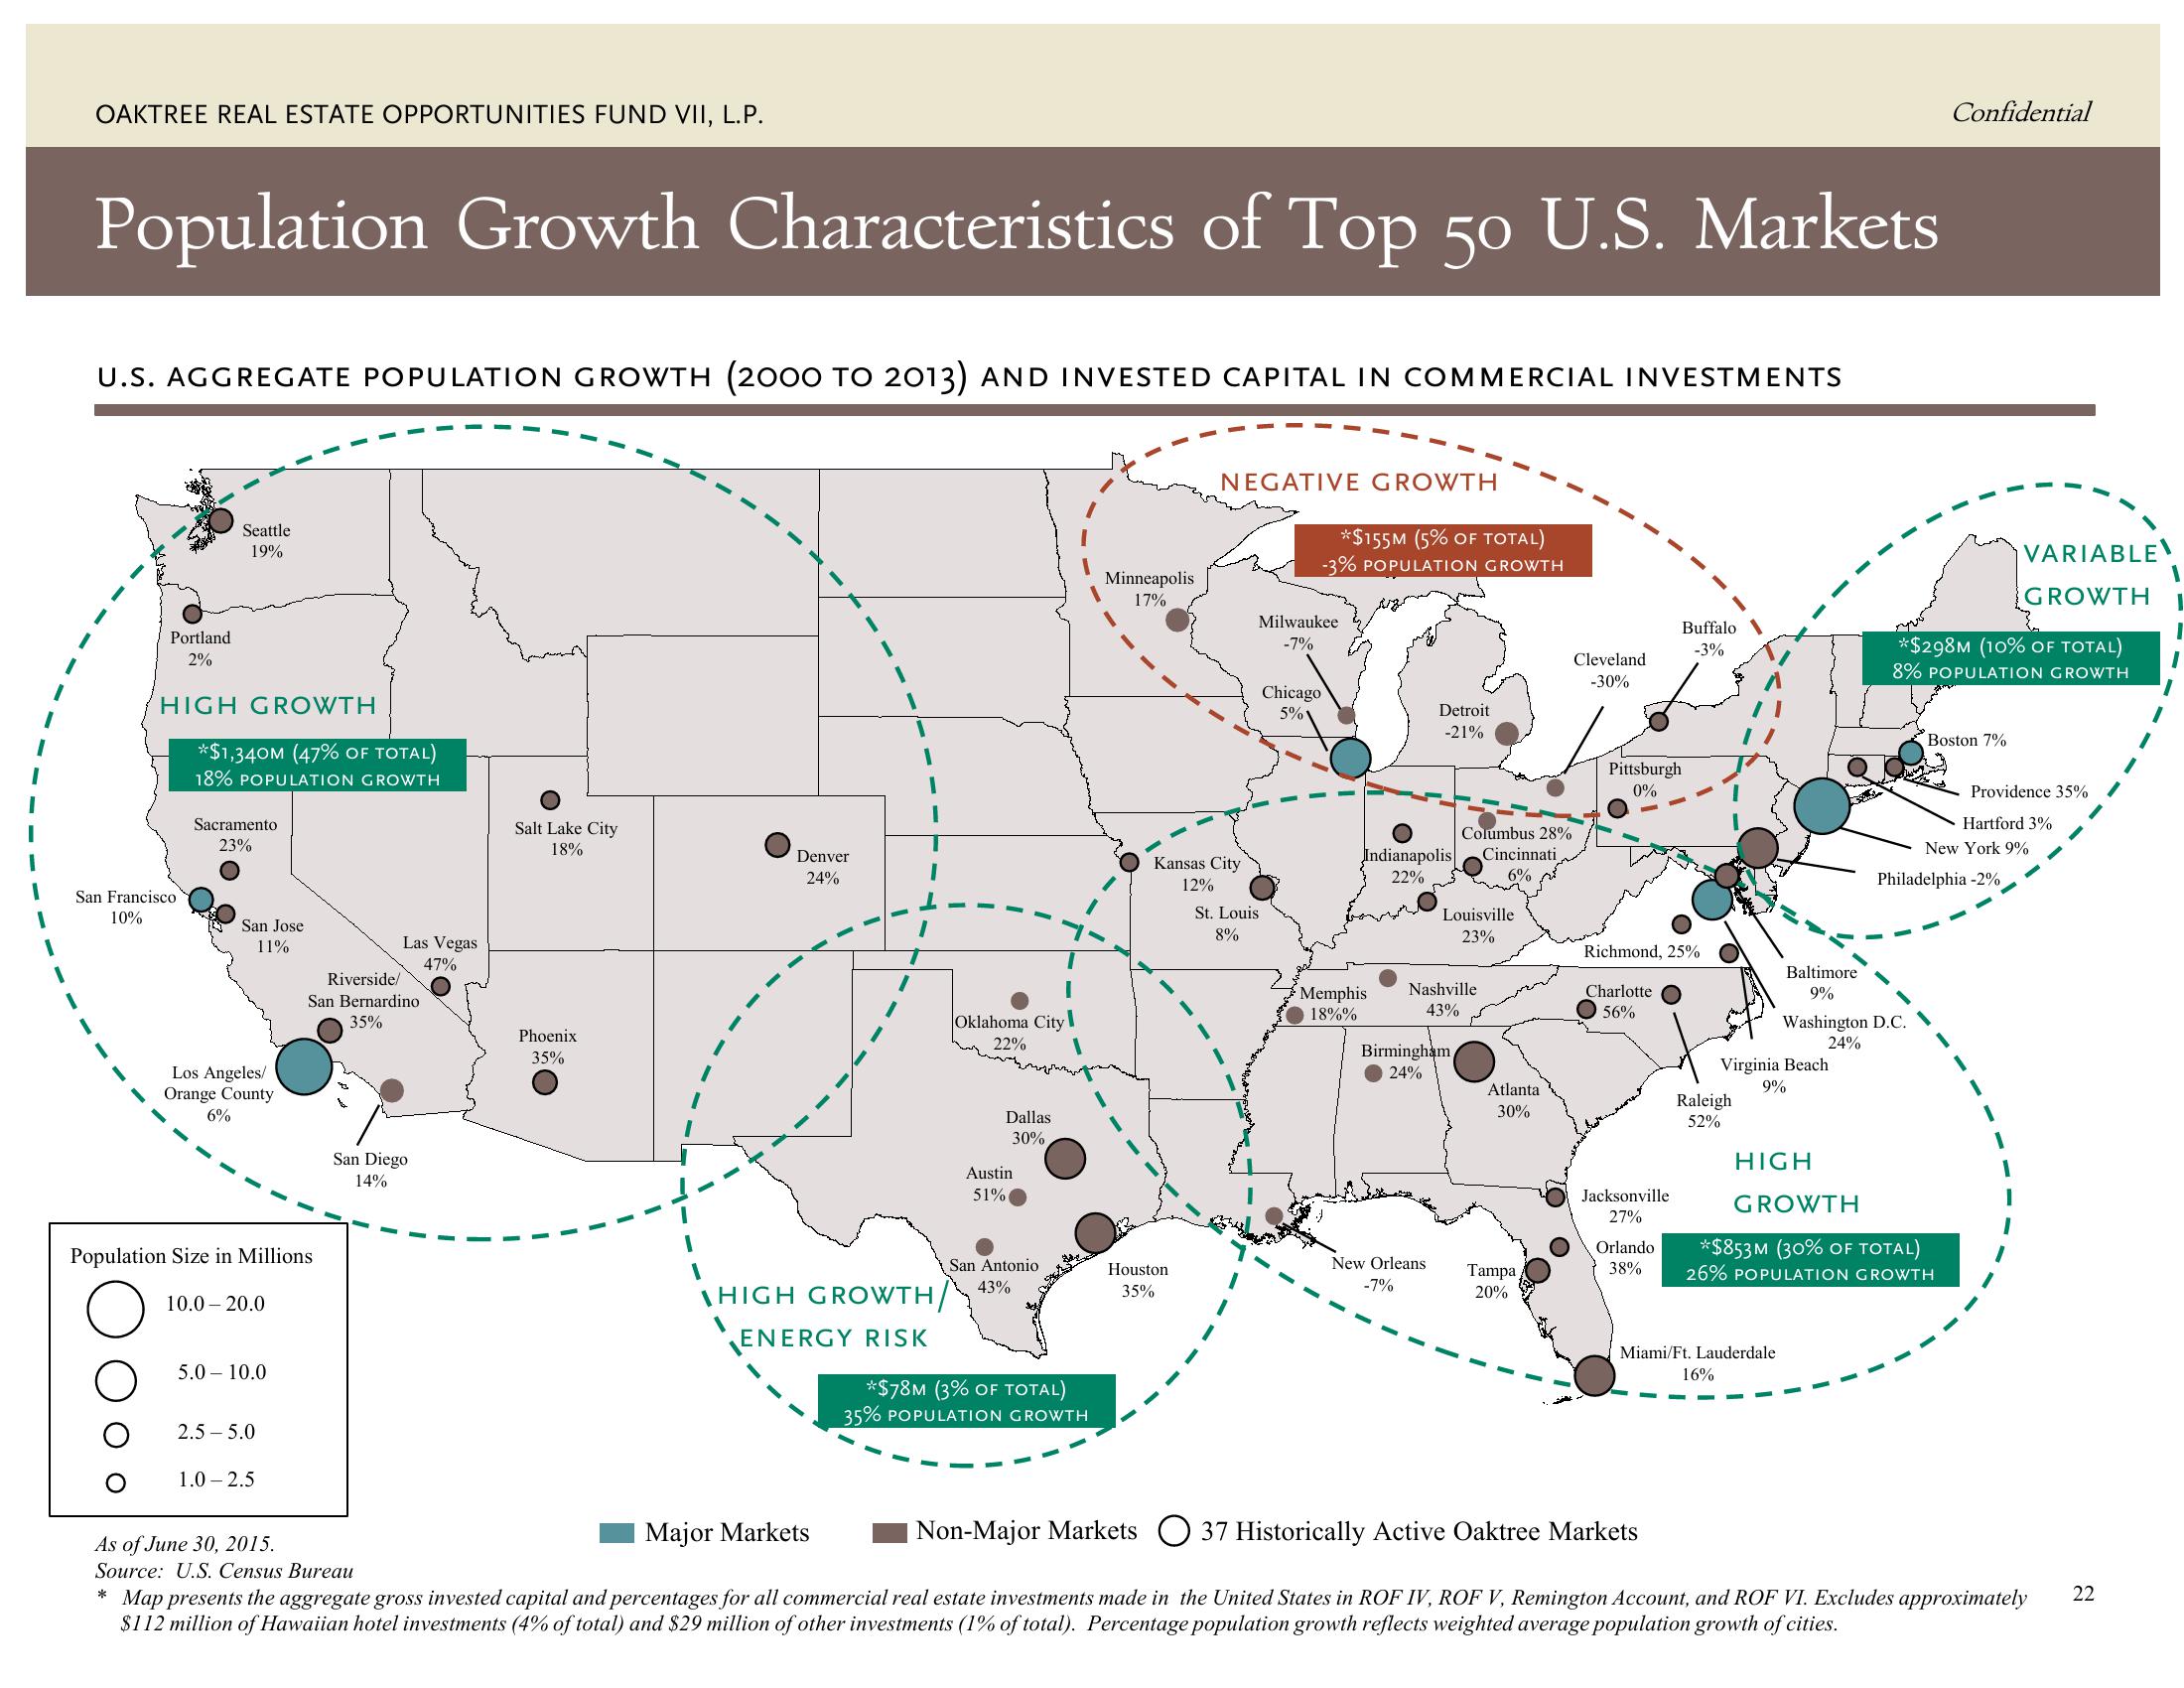
Population Growth Characteristics of Top 50 U.S. Markets
U.S. AGGREGATE POPULATION GROWTH (2000 TO 2013) AND INVESTED CAPITAL IN COMMERCIAL INVESTMENTS
Seattle
19%
Portland
2%
HIGH GROWTH
San Francisco
10%
*$1,340M (47% OF TOTAL)
18% POPULATION GROWTH
Sacramento
23%
San Jose
11%
Los Angeles/
Orange County
6%
Population Size in Millions
10.0 20.0
5.0 10.0
2.5-5.0
1.0-2.5
Riverside/
San Bernardino
35%
Las Vegas
47%
San Diego
14%
As of June 30, 2015.
Source: U.S. Census Bureau
Salt Lake City
18%
Phoenix
35%
Denver
24%
HIGH GROWTH
ENERGY RISK
Oklahoma City
22%
Dallas
30%
Austin
51%
San Antonio
43%
*$78M (3% OF TOTAL)
35% POPULATION GROWTH
Minneapolis
17%
NEGATIVE GROWTH
Kansas City
12%
Houston
35%
*$155M (5% OF TOTAL)
-3% POPULATION GROWTH
Milwaukee
-7%
St. Louis
8%
Chicago
5%
Indianapolis
22%
Memphis
18%%
Detroit
-21%
New Orleans
-7%
Columbus 28%
Cincinnati
6%
Louisville
23%
Nashville
43%
Birmingham
24%
Atlanta
30%
Tampa
20%
Cleveland
-30%
Pittsburgh
0%
Buffalo
-3%
Richmond, 25%
Charlotte
56%
Jacksonville
27%
Orlando
38%
Raleigh
52%
Virginia Beach
9%
Miami/Ft. Lauderdale
16%
Baltimore
9%
Washington D.C.
24%
Confidential
*$298M (10% OF TOTAL)
8% POPULATION GROWTH
Boston 7%
HIGH
GROWTH
*$853M (30% OF TOTAL)
26% POPULATION GROWTH
VARIABLE
GROWTH
Philadelphia -2%
Providence 35%
Hartford 3%
New York 9%
Major Markets
|Non-Major Markets O 37 Historically Active Oaktree Markets
* Map presents the aggregate gross invested capital and percentages for all commercial real estate investments made in the United States in ROF IV, ROF V, Remington Account, and ROF VI. Excludes approximately
$112 million of Hawaiian hotel investments (4% of total) and $29 million of other investments (1% of total). Percentage population growth reflects weighted average population growth of cities.
22View entire presentation