Evercore Investment Banking Pitch Book
Financial Analysis
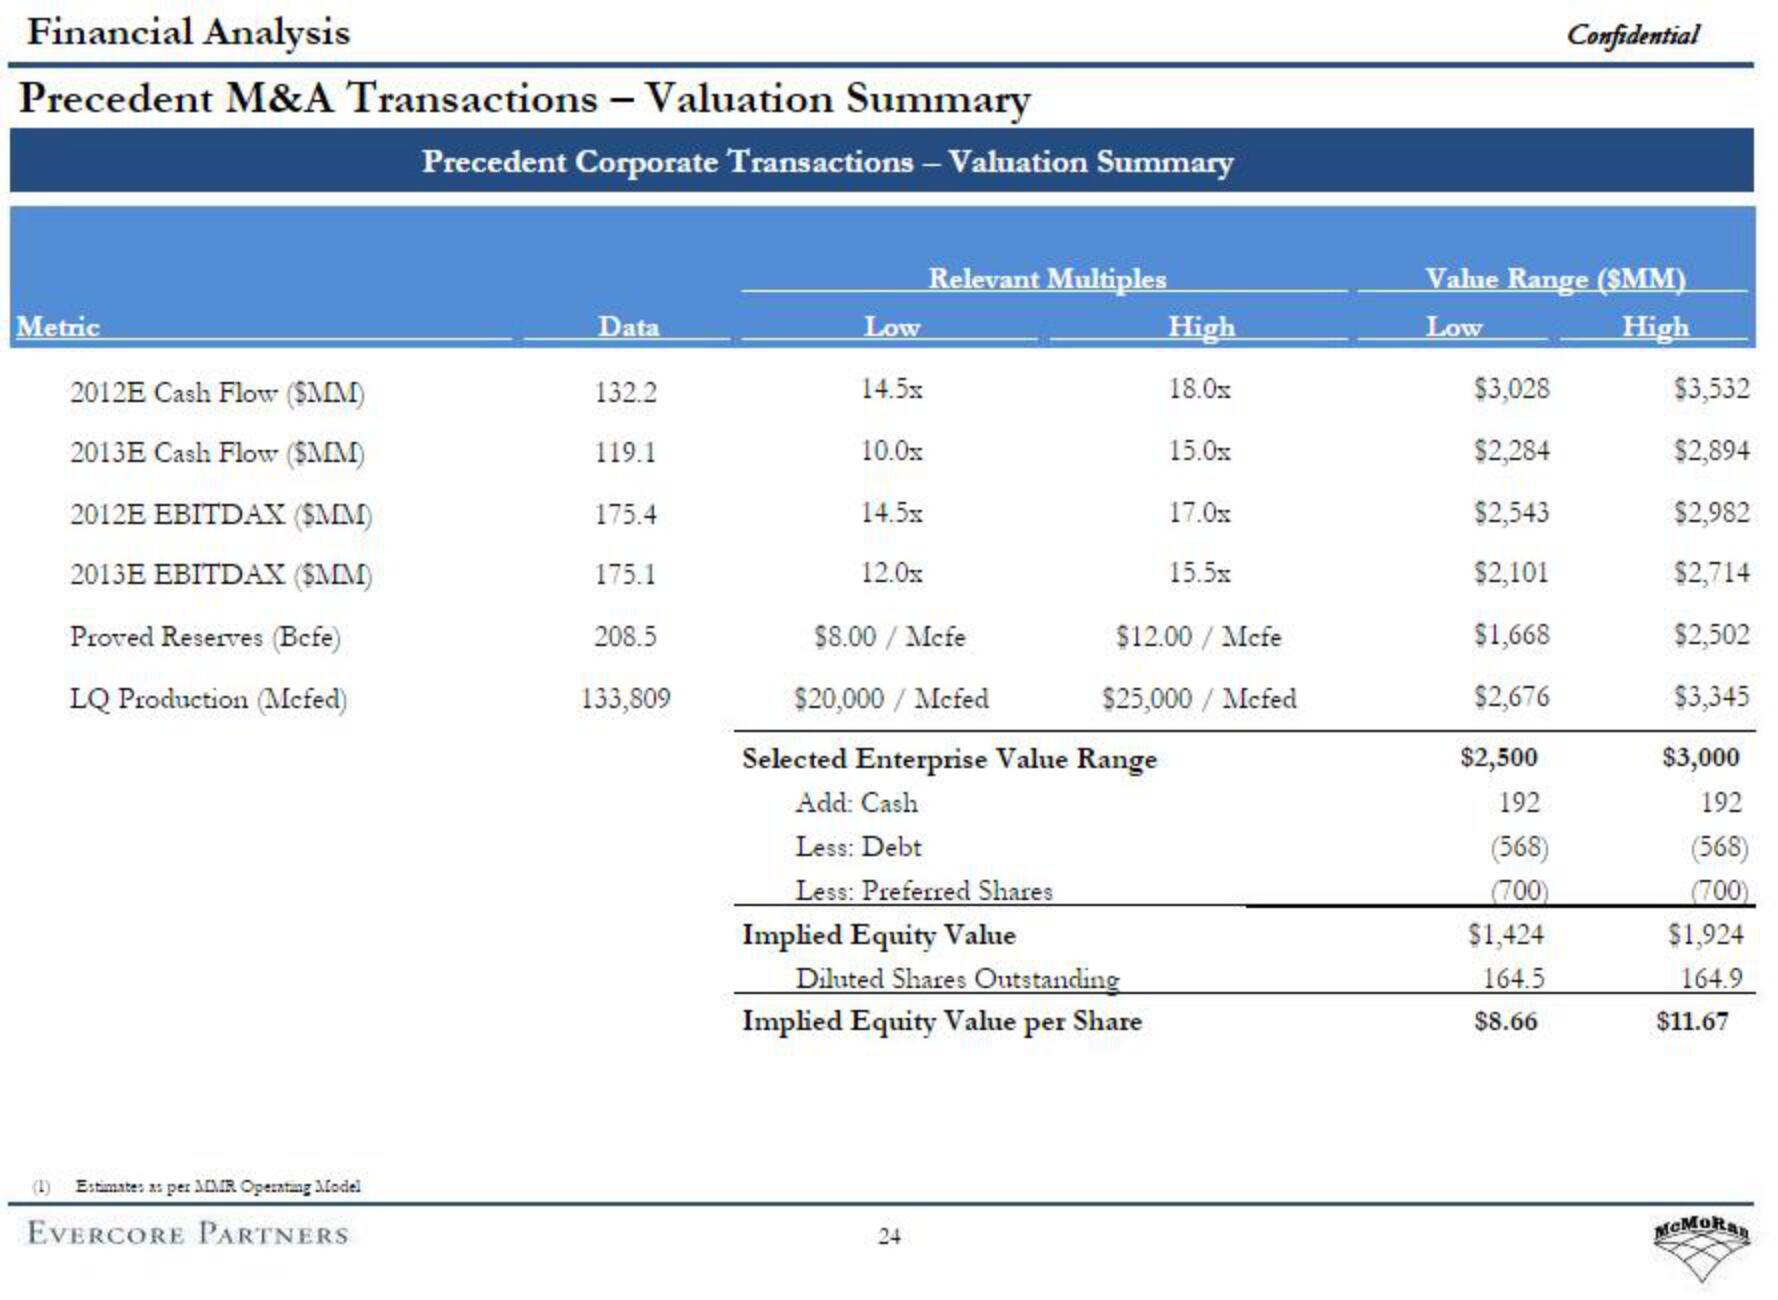
Precedent M&A Transactions - Valuation Summary
Metric
2012E Cash Flow (SMM)
2013E Cash Flow ($MM)
2012E EBITDAX ($MM)
2013E EBITDAX (SMM)
Proved Reserves (Bcfe)
LQ Production (Mcfed)
Estimates as per MMR Operating Model
EVERCORE PARTNERS
Precedent Corporate Transactions - Valuation Summary
Data
132.2
119.1
175.4
175.1
208.5
133,809
Low
145.
10.0x
145x
12.0x
Relevant Multiples
$8.00 / Mcfe
$20,000/ Mcfed
Selected Enterprise Value Range
Add: Cash
Less: Debt
Less: Preferred Shares
Implied Equity Value
High
18.0x
15.0x
17.0x
15.5
$12.00 / Mcfe
$25,000/ Mcfed
24
Diluted Shares Outstanding
Implied Equity Value per Share
Value Range ($MM)
Low
High
$3,028
$2,284
$2,543
$2,101
$1,668
$2,676
$2,500
192
(568)
(700)
$1,424
164.5
Confidential
$8.66
$3,532
$2,894
$2,982
$2,714
$2,502
$3,345
$3,000
192
(568)
(700)
$1,924
164.9
$11.67
MCMoRanView entire presentation