Dutch Bros Results Presentation Deck
(in milliions, except shop count and percentages)
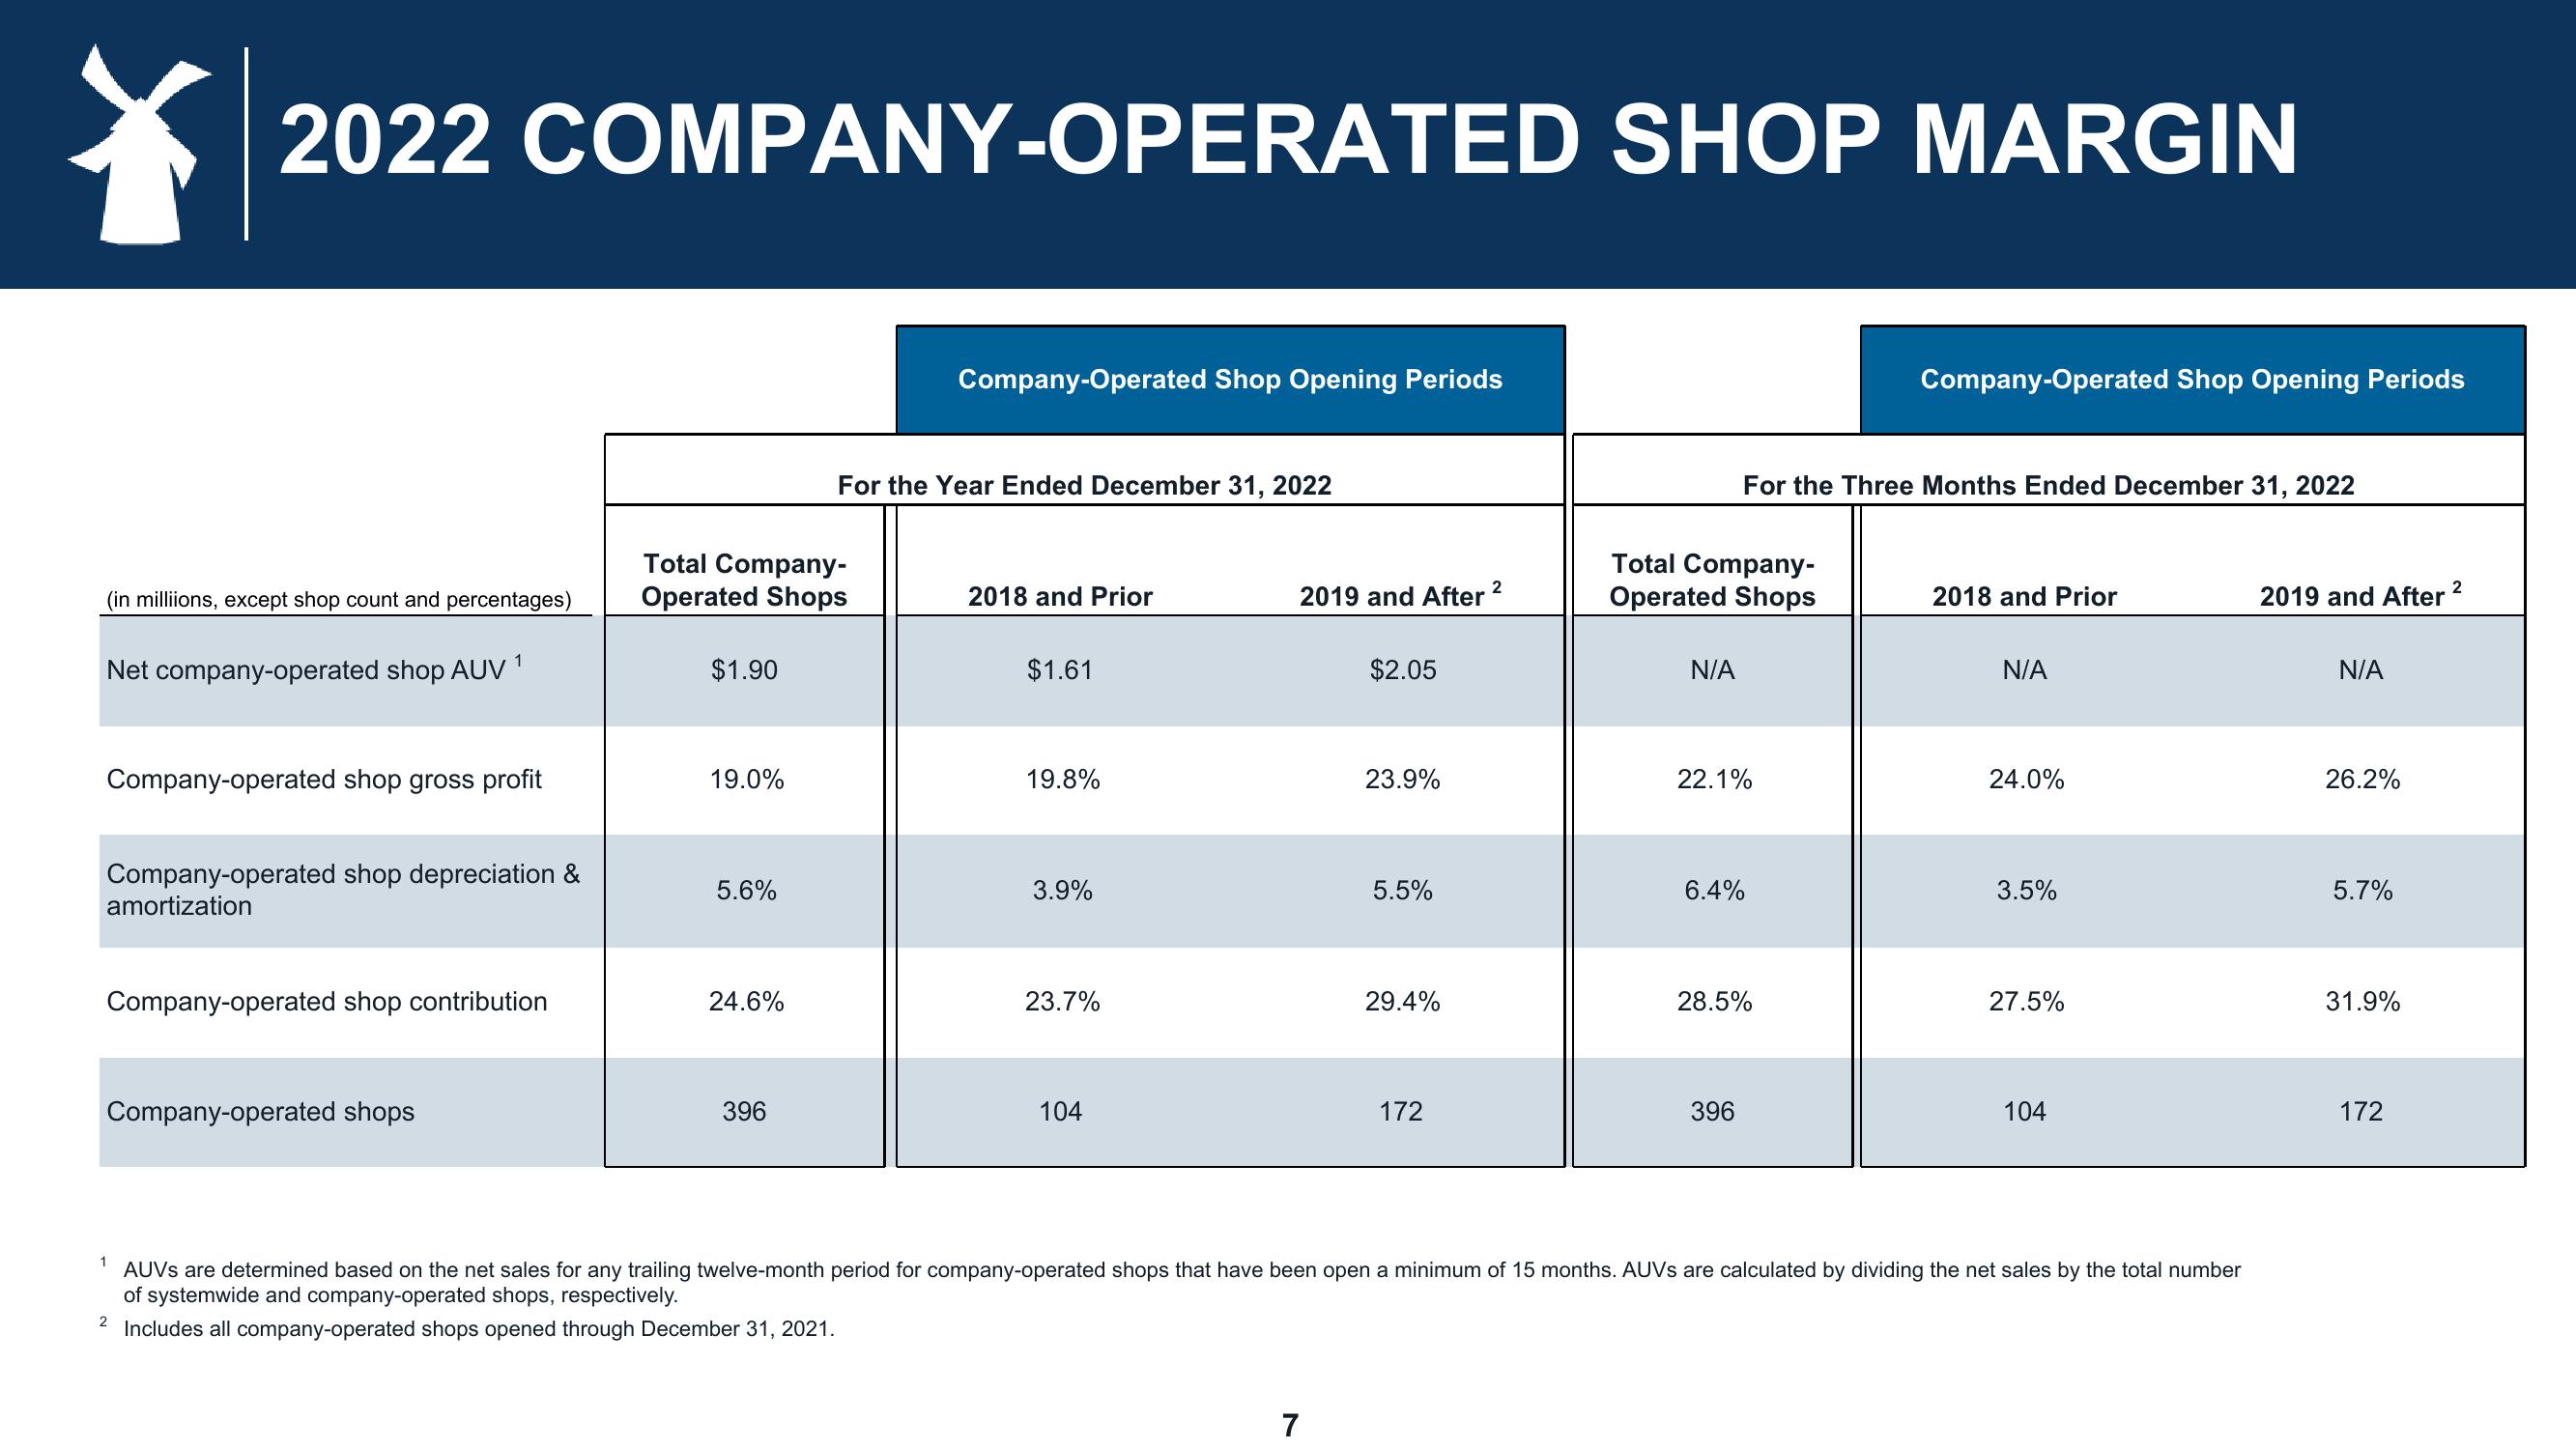
2022 COMPANY-OPERATED SHOP MARGIN
Net company-operated shop AUV¹
Company-operated shop gross profit
Company-operated shop depreciation &
amortization
Company-operated shop contribution
1
Company-operated shops
2
Total Company-
Operated Shops
$1.90
19.0%
5.6%
24.6%
396
Company-Operated Shop Opening Periods
For the Year Ended December 31, 2022
2018 and Prior
$1.61
19.8%
3.9%
23.7%
104
2019 and After
$2.05
7
23.9%
5.5%
29.4%
172
2
Total Company-
Operated Shops
N/A
22.1%
6.4%
For the Three Months Ended December 31, 2022
28.5%
396
Company-Operated Shop Opening Periods
2018 and Prior
N/A
24.0%
3.5%
27.5%
104
AUVS are determined based on the net sales for any trailing twelve-month period for company-operated shops that have been open a minimum of 15 months. AUVs are calculated by dividing the net sales by the total number
of systemwide and company-operated shops, respectively.
Includes all company-operated shops opened through December 31, 2021.
2019 and After
N/A
26.2%
5.7%
31.9%
172
2View entire presentation