BigCommerce Results Presentation Deck slide image

BigCommerce Results Presentation Deck

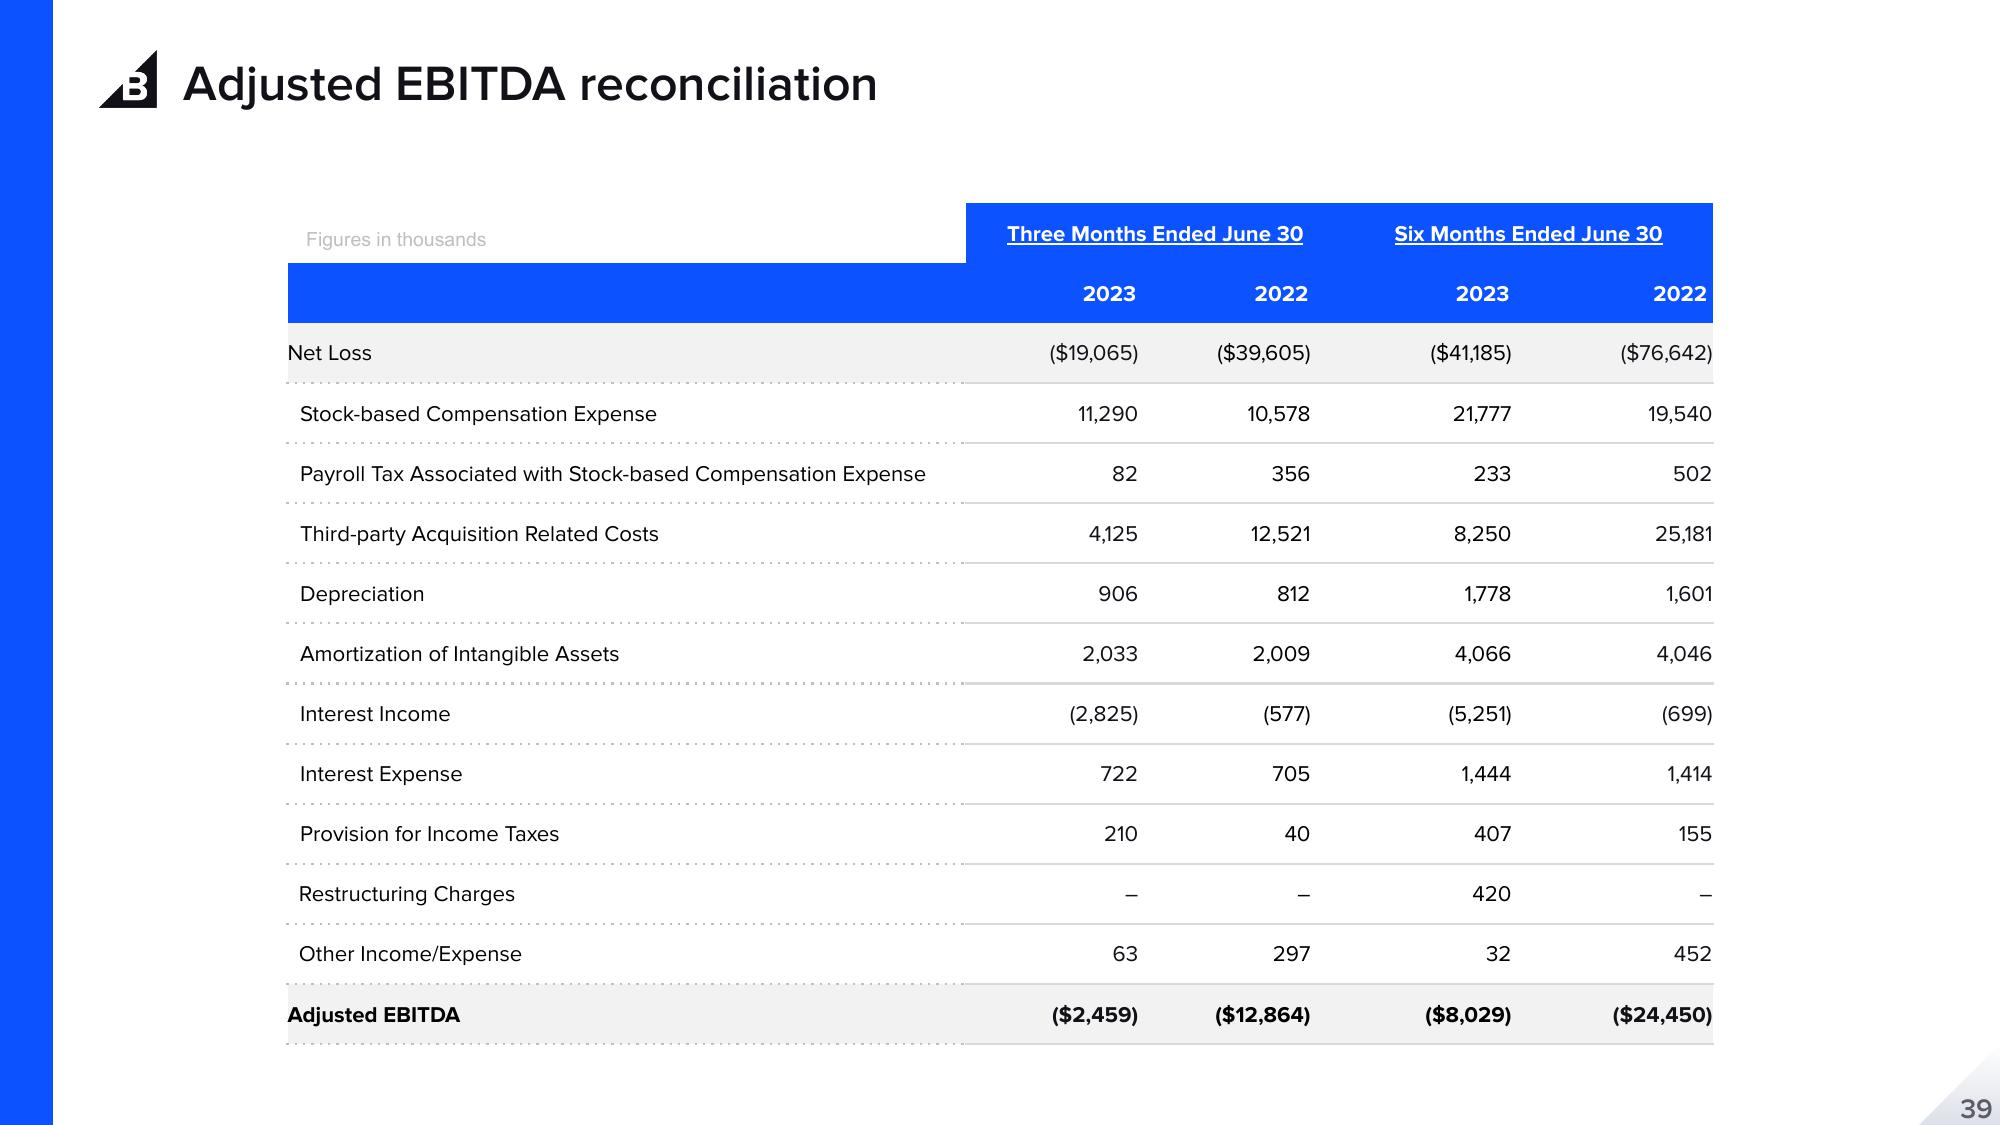
Adjusted EBITDA reconciliation Figures in thousands Net Loss Stock-based Compensation Expense Payroll Tax Associated with Stock-based Compensation Expense Third-party Acquisition Related Costs Depreciation Amortization of Intangible Assets Interest Income Interest Expense Provision for Income Taxes Restructuring Charges Other Income/Expense Adjusted EBITDA Three Months Ended June 30 2023 ($19,065) 11,290 82 4,125 906 2,033 (2,825) 722 210 63 ($2,459) 2022 ($39,605) 10,578 356 12,521 812 2,009 (577) 705 40 297 ($12,864) Six Months Ended June 30 2023 ($41,185) 21,777 233 8,250 1,778 4,066 (5,251) 1,444 407 420 32 ($8,029) 2022 ($76,642) 19,540 502 25,181 1,601 4,046 (699) 1,414 155 452 ($24,450) 39
View entire presentation