FlexJet SPAC Presentation Deck
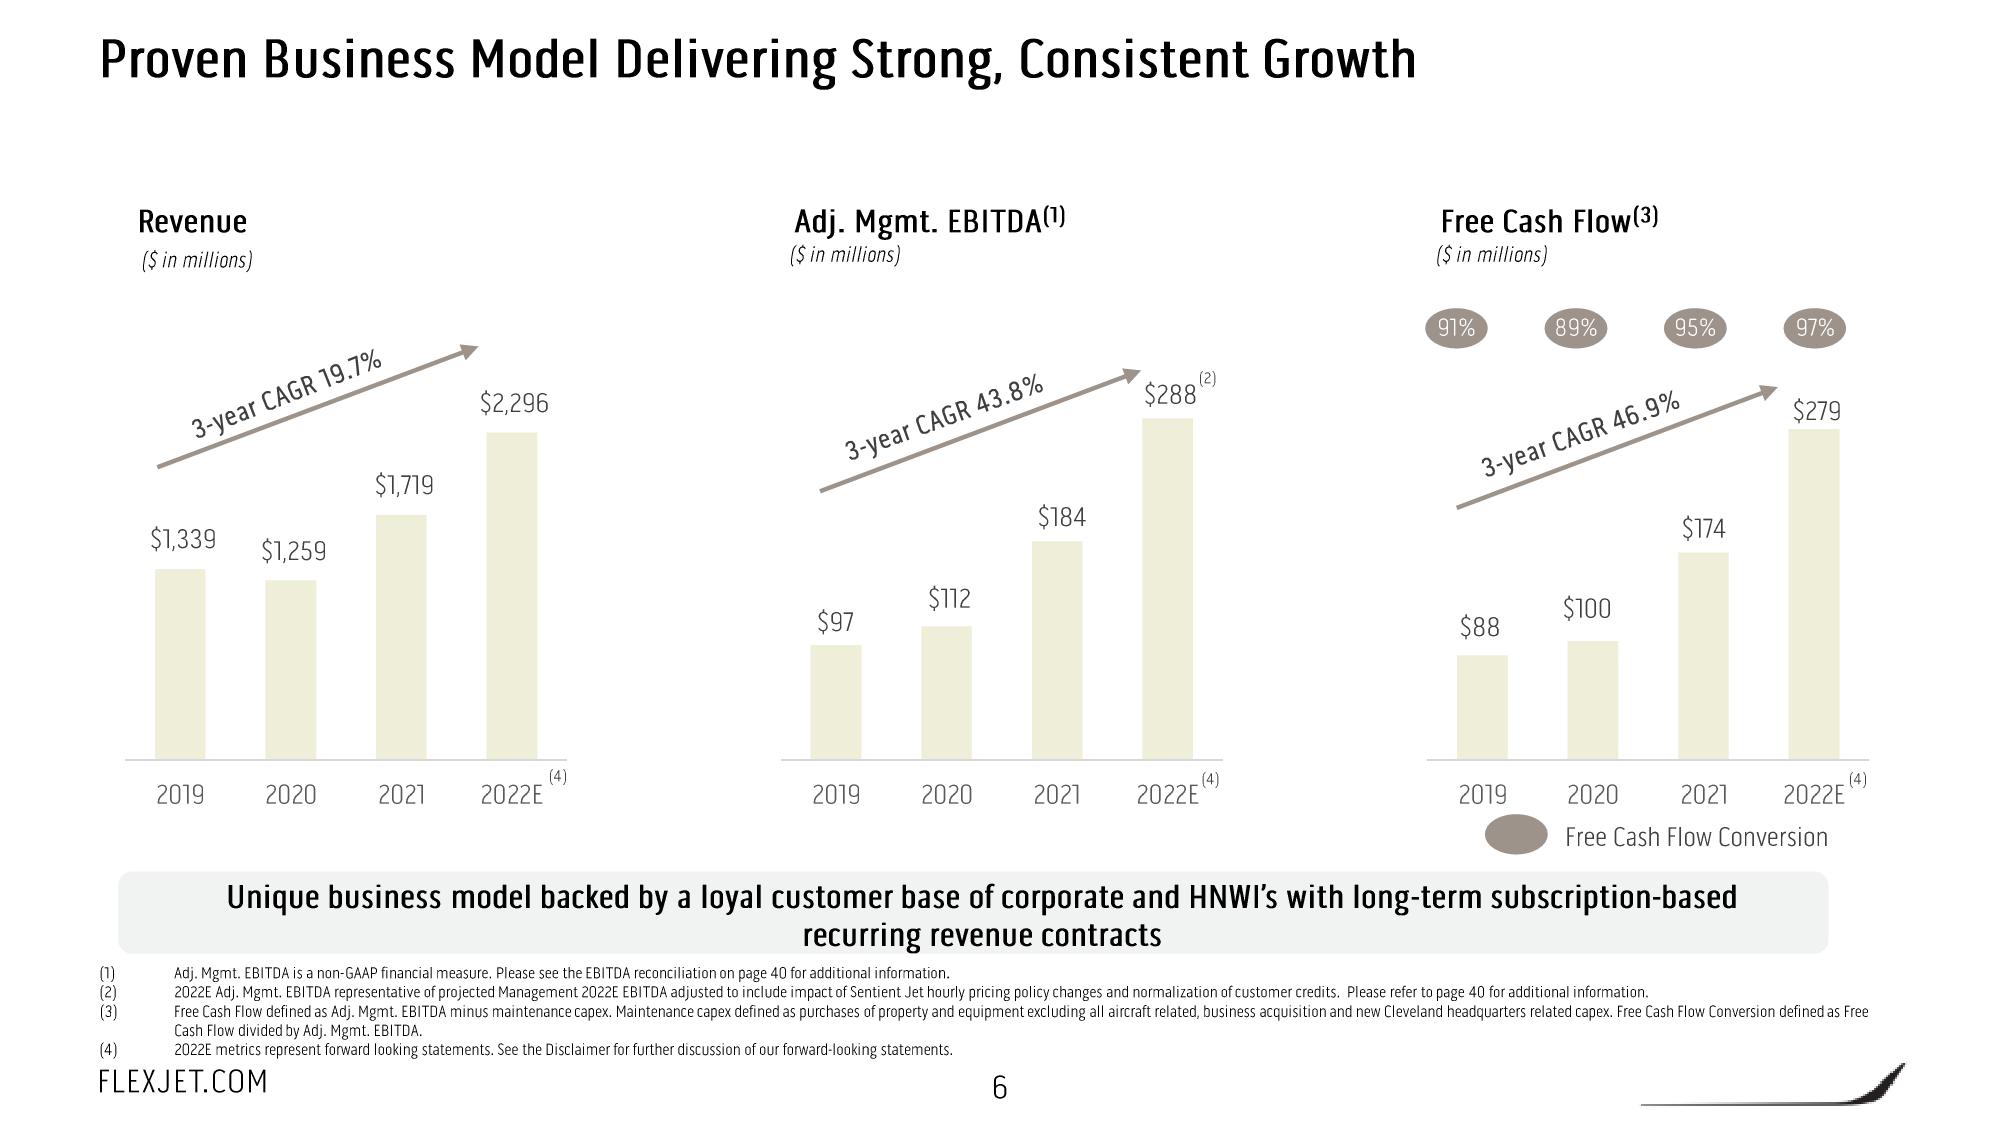
Proven Business Model Delivering Strong, Consistent Growth
(1)
(3)
(4)
Revenue
($ in millions)
3-year CAGR 19.7%
$1,339
2019
$1,259
2020
$1,719
$2,296
2021 2022E
(4)
Adj. Mgmt. EBITDA(¹)
($ in millions)
3-year CAGR 43.8%
$97
2019
$112
2020
$184
$288
6
(2)
2021 2022E
(4)
Free Cash Flow (3)
($ in millions)
91%
$88
89%
3-year CAGR 46.9%
2019
95%
$100
$174
Unique business model backed by a loyal customer base of corporate and HNWI's with long-term subscription-based
recurring revenue contracts
97%
$279
2020
2021 2022E
Free Cash Flow Conversion
Adj. Mgmt. EBITDA is a non-GAAP financial measure. Please see the EBITDA reconciliation on page 40 for additional information.
2022E Adj. Mgmt. EBITDA representative of projected Management 2022E EBITDA adjusted to include impact of Sentient Jet hourly pricing policy changes and normalization of customer credits. Please refer to page 40 for additional information.
Free Cash Flow defined as Adj. Mgmt. EBITDA minus maintenance capex. Maintenance capex defined as purchases of property and equipment excluding all aircraft related, business acquisition and new Cleveland headquarters related capex. Free Cash Flow Conversion defined as Free
Cash Flow divided by Adj. Mgmt. EBITDA.
2022E metrics represent forward looking statements. See the Disclaimer for further discussion of our forward-looking statements.
FLEXJET.COMView entire presentation