Cboe Results Presentation Deck
Expense Bridge Summary
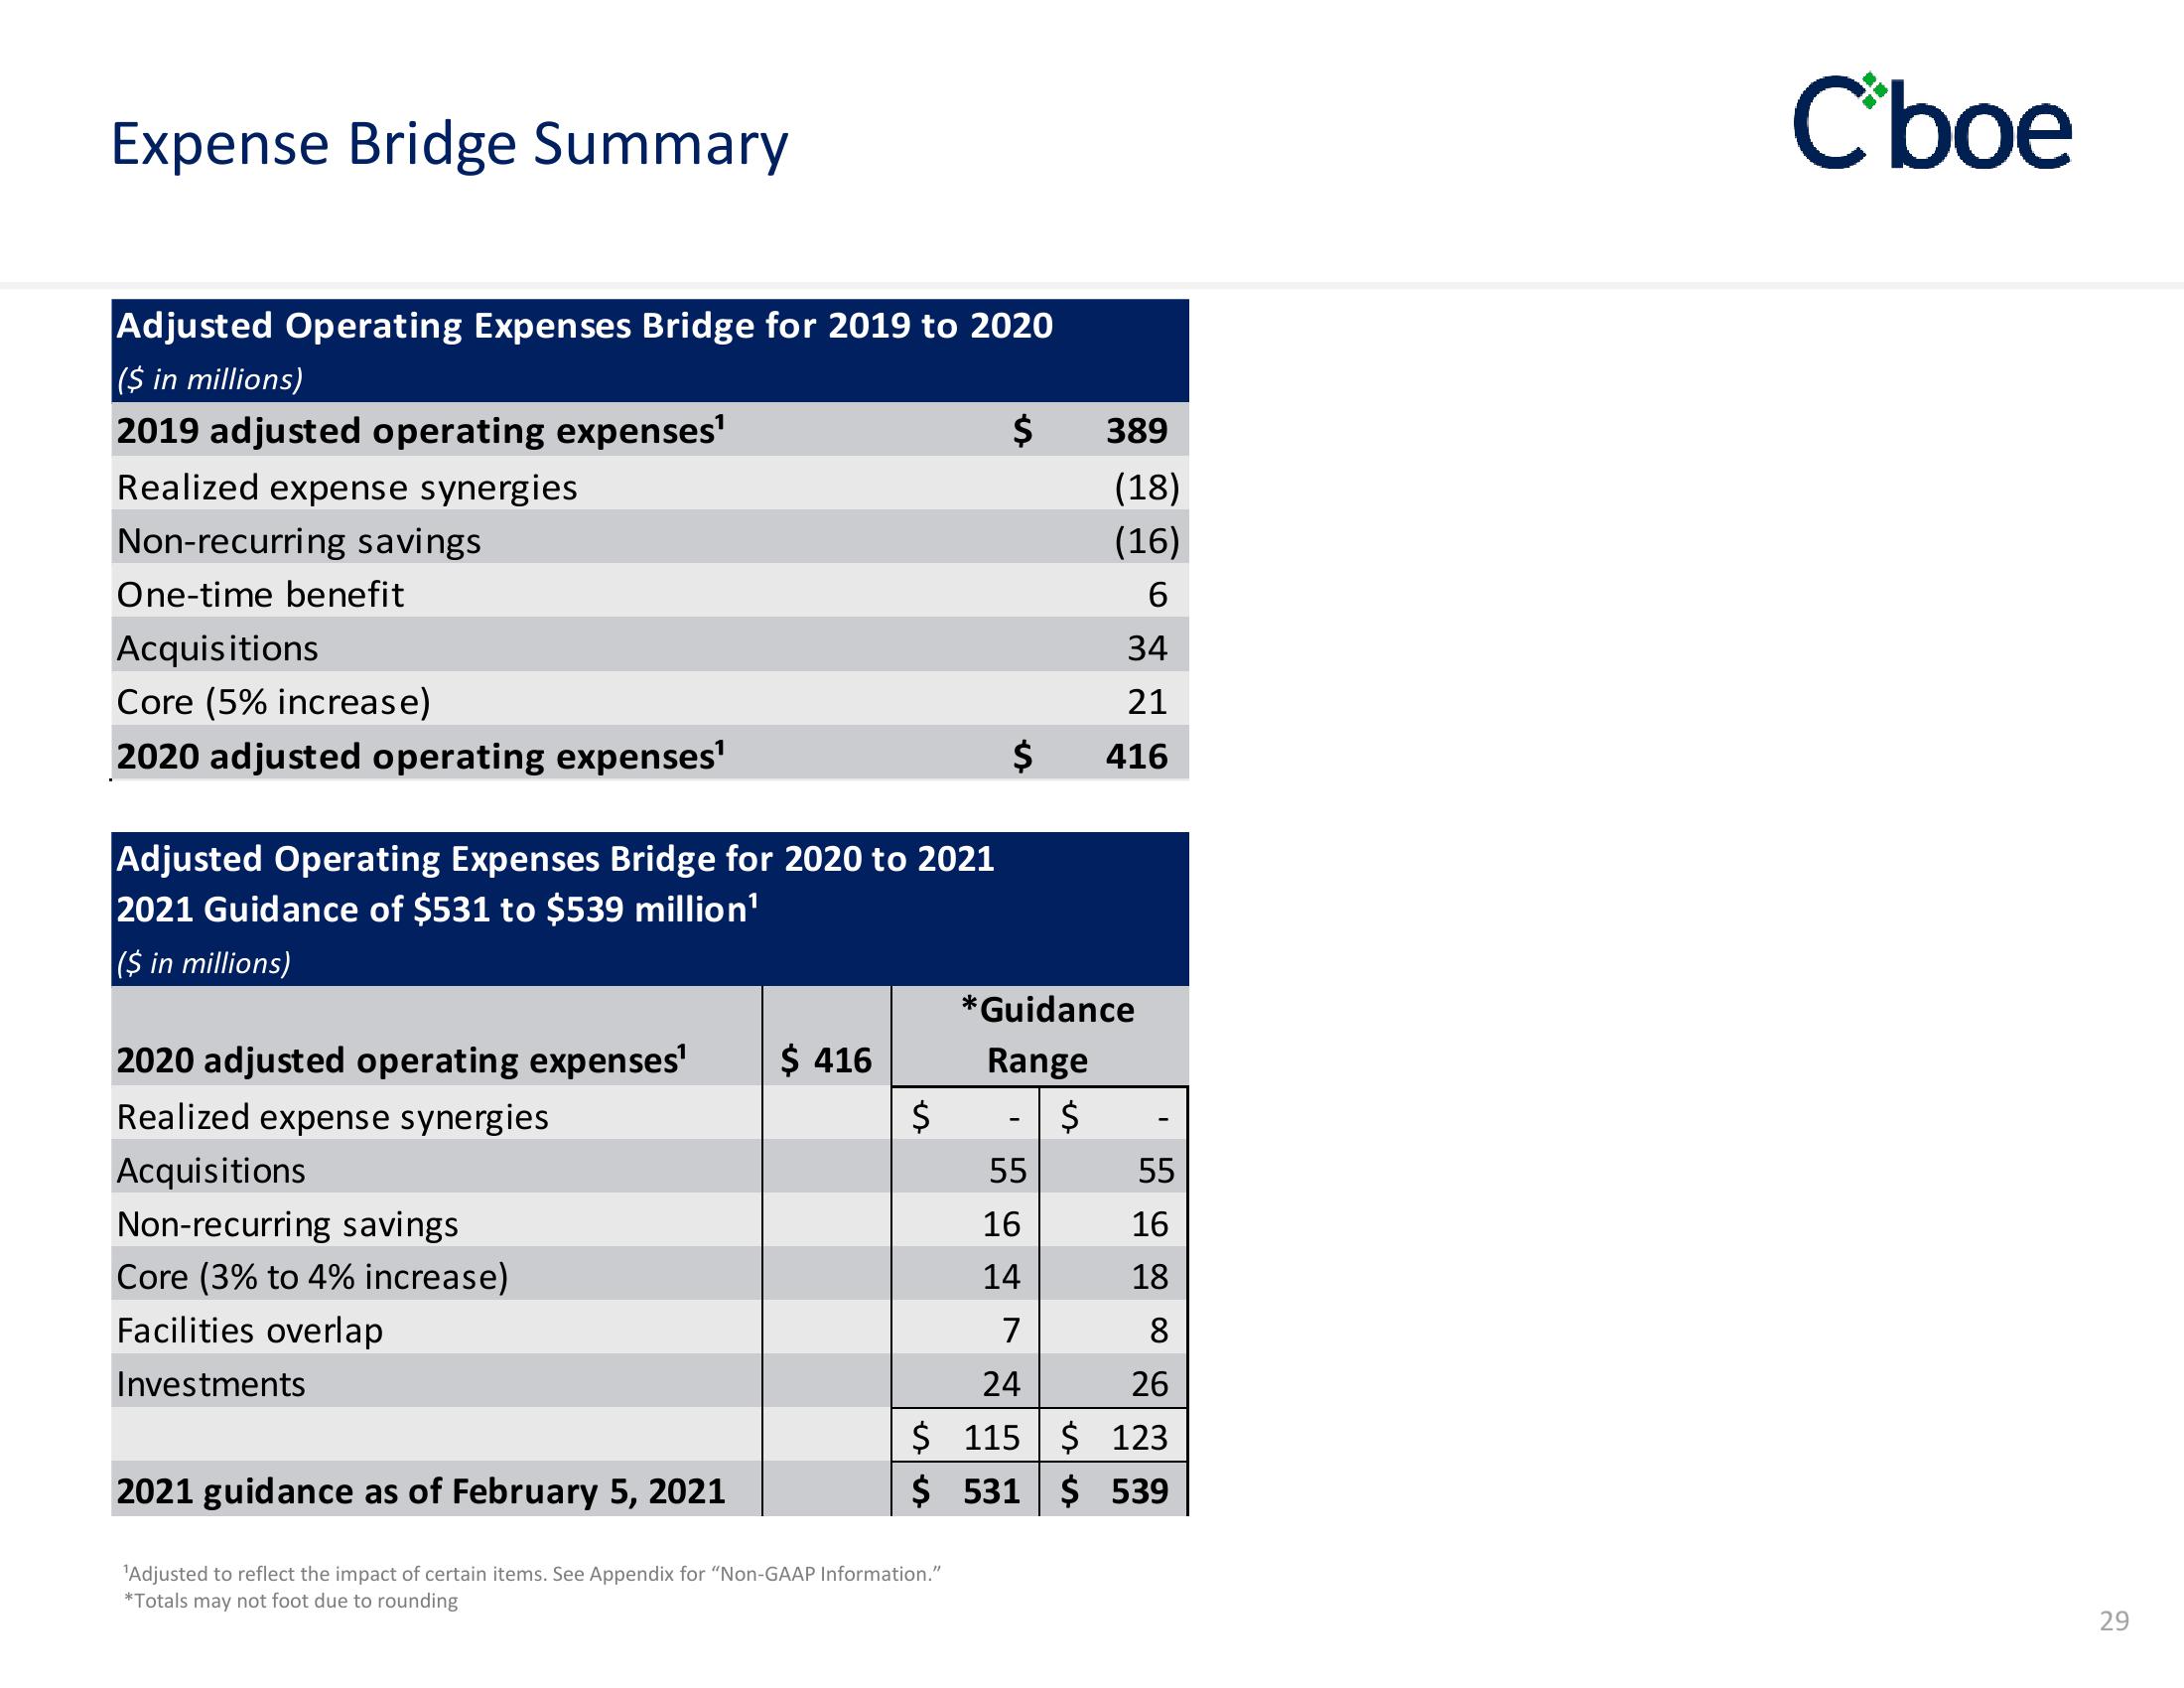
Adjusted Operating Expenses Bridge for 2019 to 2020
($ in millions)
2019 adjusted operating expenses¹
Realized expense synergies
Non-recurring savings
One-time benefit
Acquisitions
Core (5% increase)
2020 adjusted operating expenses¹
Adjusted Operating Expenses Bridge for 2020 to 2021
2021 Guidance of $531 to $539 million¹
($ in millions)
2020 adjusted operating expenses¹
Realized expense synergies
Acquisitions
Non-recurring savings
Core (3% to 4% increase)
Facilities overlap
Investments
$ 416
Ś
$
2021 guidance as of February 5, 2021
¹Adjusted to reflect the impact of certain items. See Appendix for "Non-GAAP Information."
*Totals may not foot due to rounding
$
55
389
*Guidance
Range
$
16
14
(18)
(16)
6
34
21
416
16
18
7
8
24
26
$ 115 $ 123
$ 531 $539
55
Cboe
29View entire presentation