Nexters Results Presentation Deck
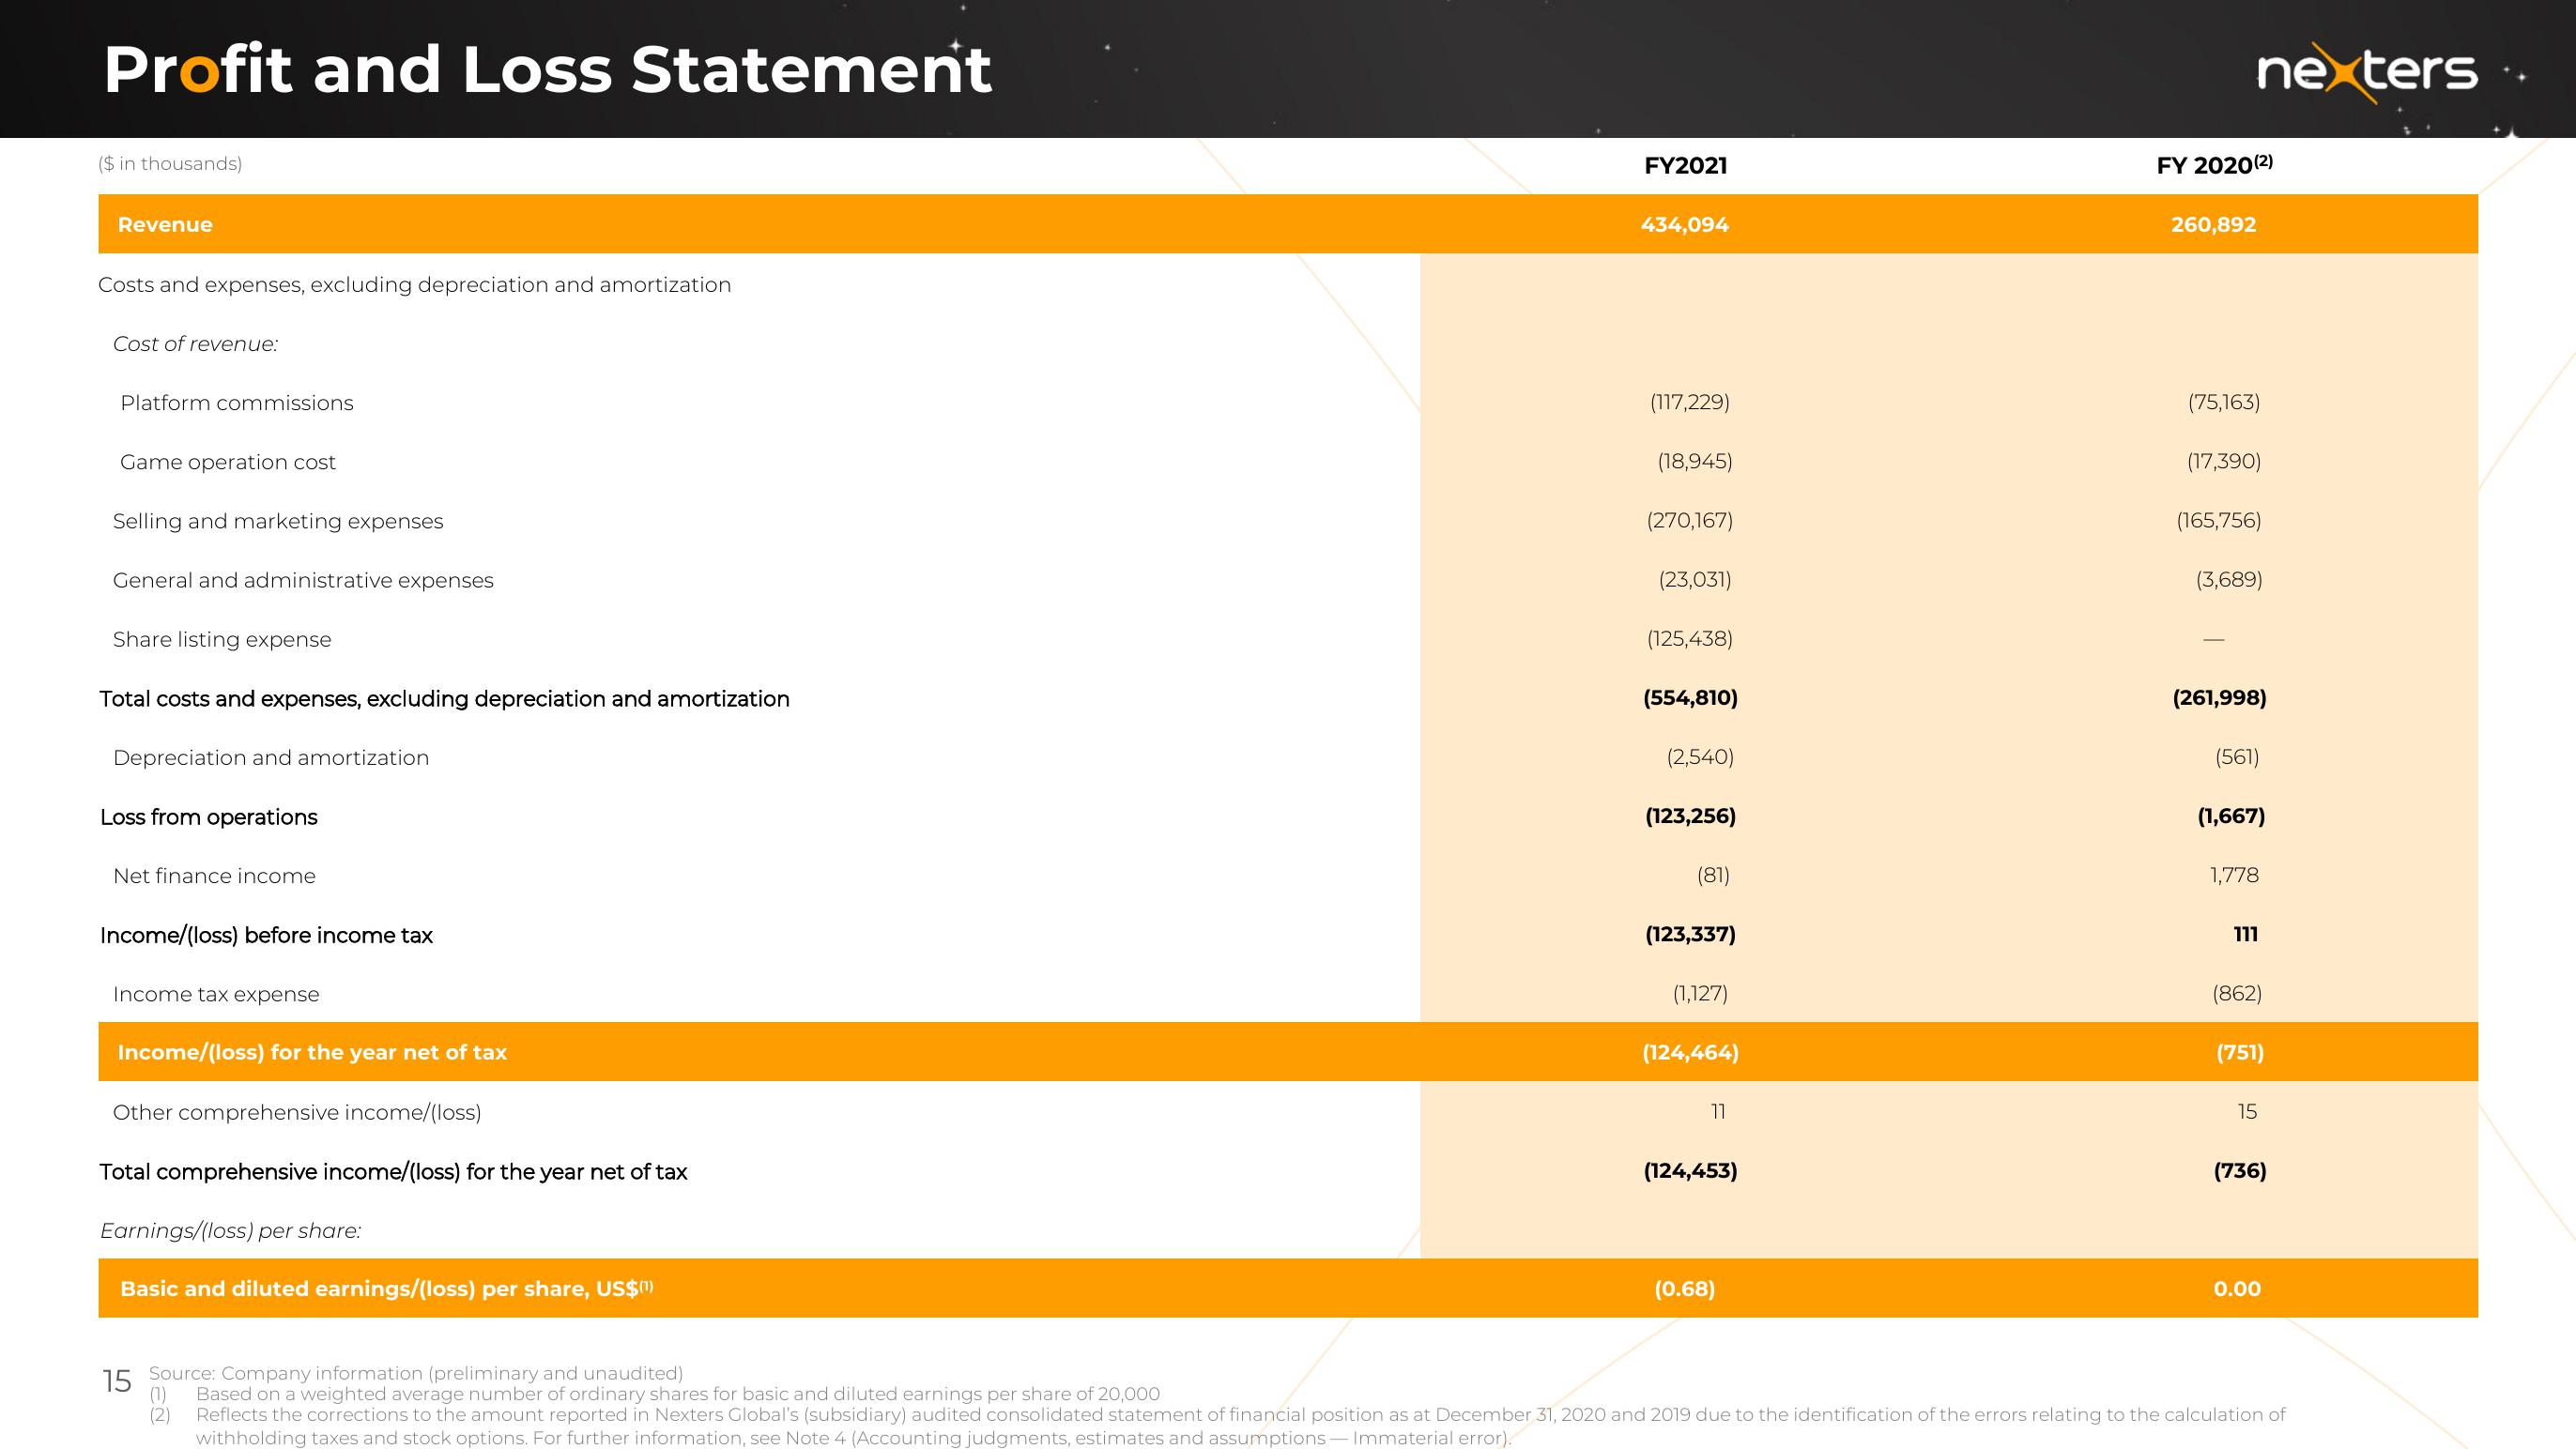
Profit and Loss Statement
($ in thousands)
Revenue
Costs and expenses, excluding depreciation and amortization
Cost of revenue:
Platform commissions
Game operation cost
Selling and marketing expenses
General and administrative expenses
Share listing expense
Total costs and expenses, excluding depreciation and amortization
Depreciation and amortization
Loss from operations
Net finance income
Income/(loss) before income tax
Income tax expense
Income/(loss) for the year net of tax
Other comprehensive income/(loss)
Total comprehensive income/(loss) for the year net of tax
Earnings/(loss) per share:
Basic and diluted earnings/(loss) per share, US$(¹)
FY2021
(1)
(2)
434,094
(117,229)
(18,945)
(270,167)
(23,031)
(125,438)
(554,810)
(2,540)
(123,256)
(81)
(123,337)
(1,127)
(124,464)
11
(124,453)
(0.68)
nexters.
FY 2020(2)
260,892
(75,163)
(17,390)
(165,756)
(3,689)
(261,998)
(561)
(1,667)
1,778
111
(862)
(751)
15
(736)
0.00
15 Source: Company information (preliminary and unaudited)
Based on a weighted average number of ordinary shares for basic and diluted earnings per share of 20,000
Reflects the corrections to the amount reported in Nexters Global's (subsidiary) audited consolidated statement of financial position as at December 31, 2020 and 2019 due to the identification of the errors relating to the calculation of
withholding taxes and stock options. For further information, see Note 4 (Accounting judgments, estimates and assumptions-Immaterial error).View entire presentation