Credit Suisse Investment Banking Pitch Book
PRELIMINARY | SUBJECT TO FURTHER REVIEW & REVISION
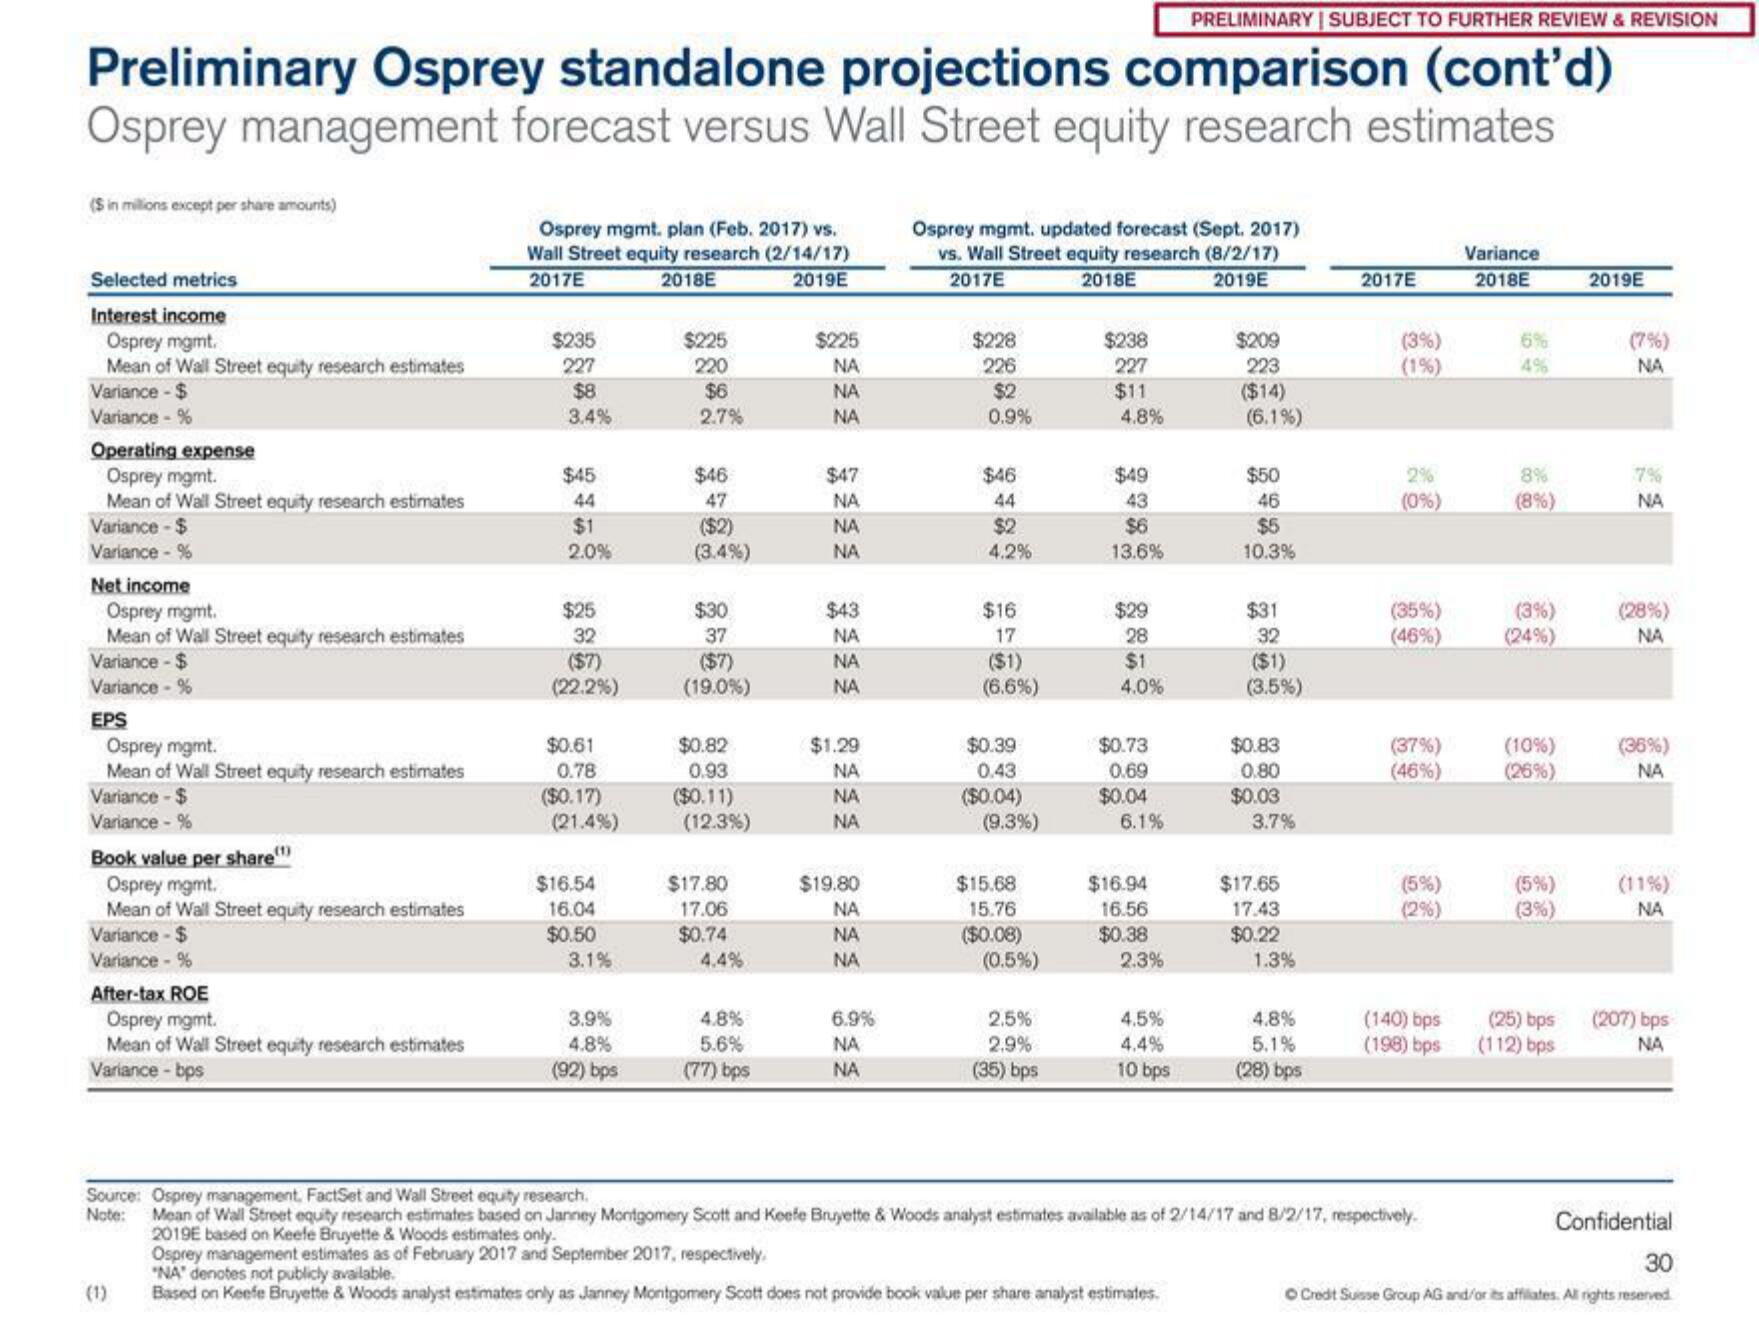
Preliminary Osprey standalone projections comparison (cont'd)
Osprey management forecast versus Wall Street equity research estimates
(Sin millions except per share amounts)
Selected metrics
Interest income
Osprey mgmt.
Mean of Wall Street equity research estimates
Variance - $
Variance - %
Operating expense
Osprey mgmt.
Mean of Wall Street equity research estimates
Variance-$
Variance - %
Net income
Osprey mgmt.
Mean of Wall Street equity research estimates
Variance - $
Variance - %
EPS
Osprey mgmt.
Mean of Wall Street equity research estimates
Variance-$
Variance - %
Book value per share
Osprey mgmt.
Mean of Wall Street equity research estimates
Variance - $
Variance - %
After-tax ROE
Osprey mgmt.
Mean of Wall Street equity research estimates
Variance-bps
Osprey mgmt. plan (Feb. 2017) vs.
Wall Street equity research (2/14/17)
2017E
2018E
2019E
(1)
$235
227
$8
3.4%
$45
44
$1
2.0%
$25
32
($7)
(22.2%)
$0.61
0.78
($0.17)
(21.4%)
$16.54
16.04
$0.50
3.1%
3.9%
4.8%
(92) bps
$225
220
$6
2.7%
$46
47
($2)
(3.4%)
$30
37
($7)
(19.0%)
$0.82
0.93
($0.11)
(12.3%)
$17.80
17.06
$0.74
4.4%
4.8%
5.6%
(77) bps
$225
NA
ΝΑ
ΝΑ
$47
NA
NA
NA
$43
NA
NA
ΝΑ
$1.29
ΝΑ
NA
ΝΑ
$19.80
NA
ΝΑ
NA
6.9%
NA
ΝΑ
Osprey mgmt. updated forecast (Sept. 2017)
vs. Wall Street equity research (8/2/17)
2017E
2018E
2019E
$228
226
$2
0.9%
$46
44
$2
4.2%
$16
17
($1)
(6.6%)
$0.39
0.43
($0.04)
(9.3%)
$15.68
15.76
($0.08)
(0.5%)
2.5%
2.9%
(35) bps
$238
227
$11
4.8%
$49
43
$6
13.6%
$29
28
$1
4.0%
$0.73
0.69
$0.04
6.1%
$16.94
16.56
$0.38
2.3%
4.5%
4.4%
10 bps
$209
223
($14)
"NA" denotes not publicly available.
Based on Keefe Bruyette & Woods analyst estimates only as Janney Montgomery Scott does not provide book value per share analyst estimates.
(6.1%)
$50
46
$5
10.3%
$31
32
($1)
(3.5%)
$0.83
0.80
$0.03
3.7%
$17.65
17.43
$0.22
1.3%
4.8%
5.1%
(28) bps
2017E
(3%)
(1%)
2%
(0%)
(35%)
(46%)
(37%)
(46%)
(5%)
(2%)
Source: Osprey management, FactSet and Wall Street equity research.
Note: Mean of Wall Street equity research estimates based on Janney Montgomery Scott and Keefe Bruyette & Woods analyst estimates available as of 2/14/17 and 8/2/17, respectively.
2019E based on Keele Bruyette & Woods estimates only.
Osprey management estimates as of February 2017 and September 2017, respectively,
(140) bps
(198) bps
Variance
2018E
6%
4%
8%
(8%)
(3%)
(24%)
(10%)
(26%)
(5%)
(3%)
(25) bps
(112) bps
2019E
NA
7%
NA
(28%)
NA
(35%)
ΝΑ
(11%)
NA
(207) bps
NA
Confidential
30
Ⓒ Credit Suisse Group AG and/or its affiliates. All rights reserved.View entire presentation