Capri Holdings Investor Day Presentation Deck
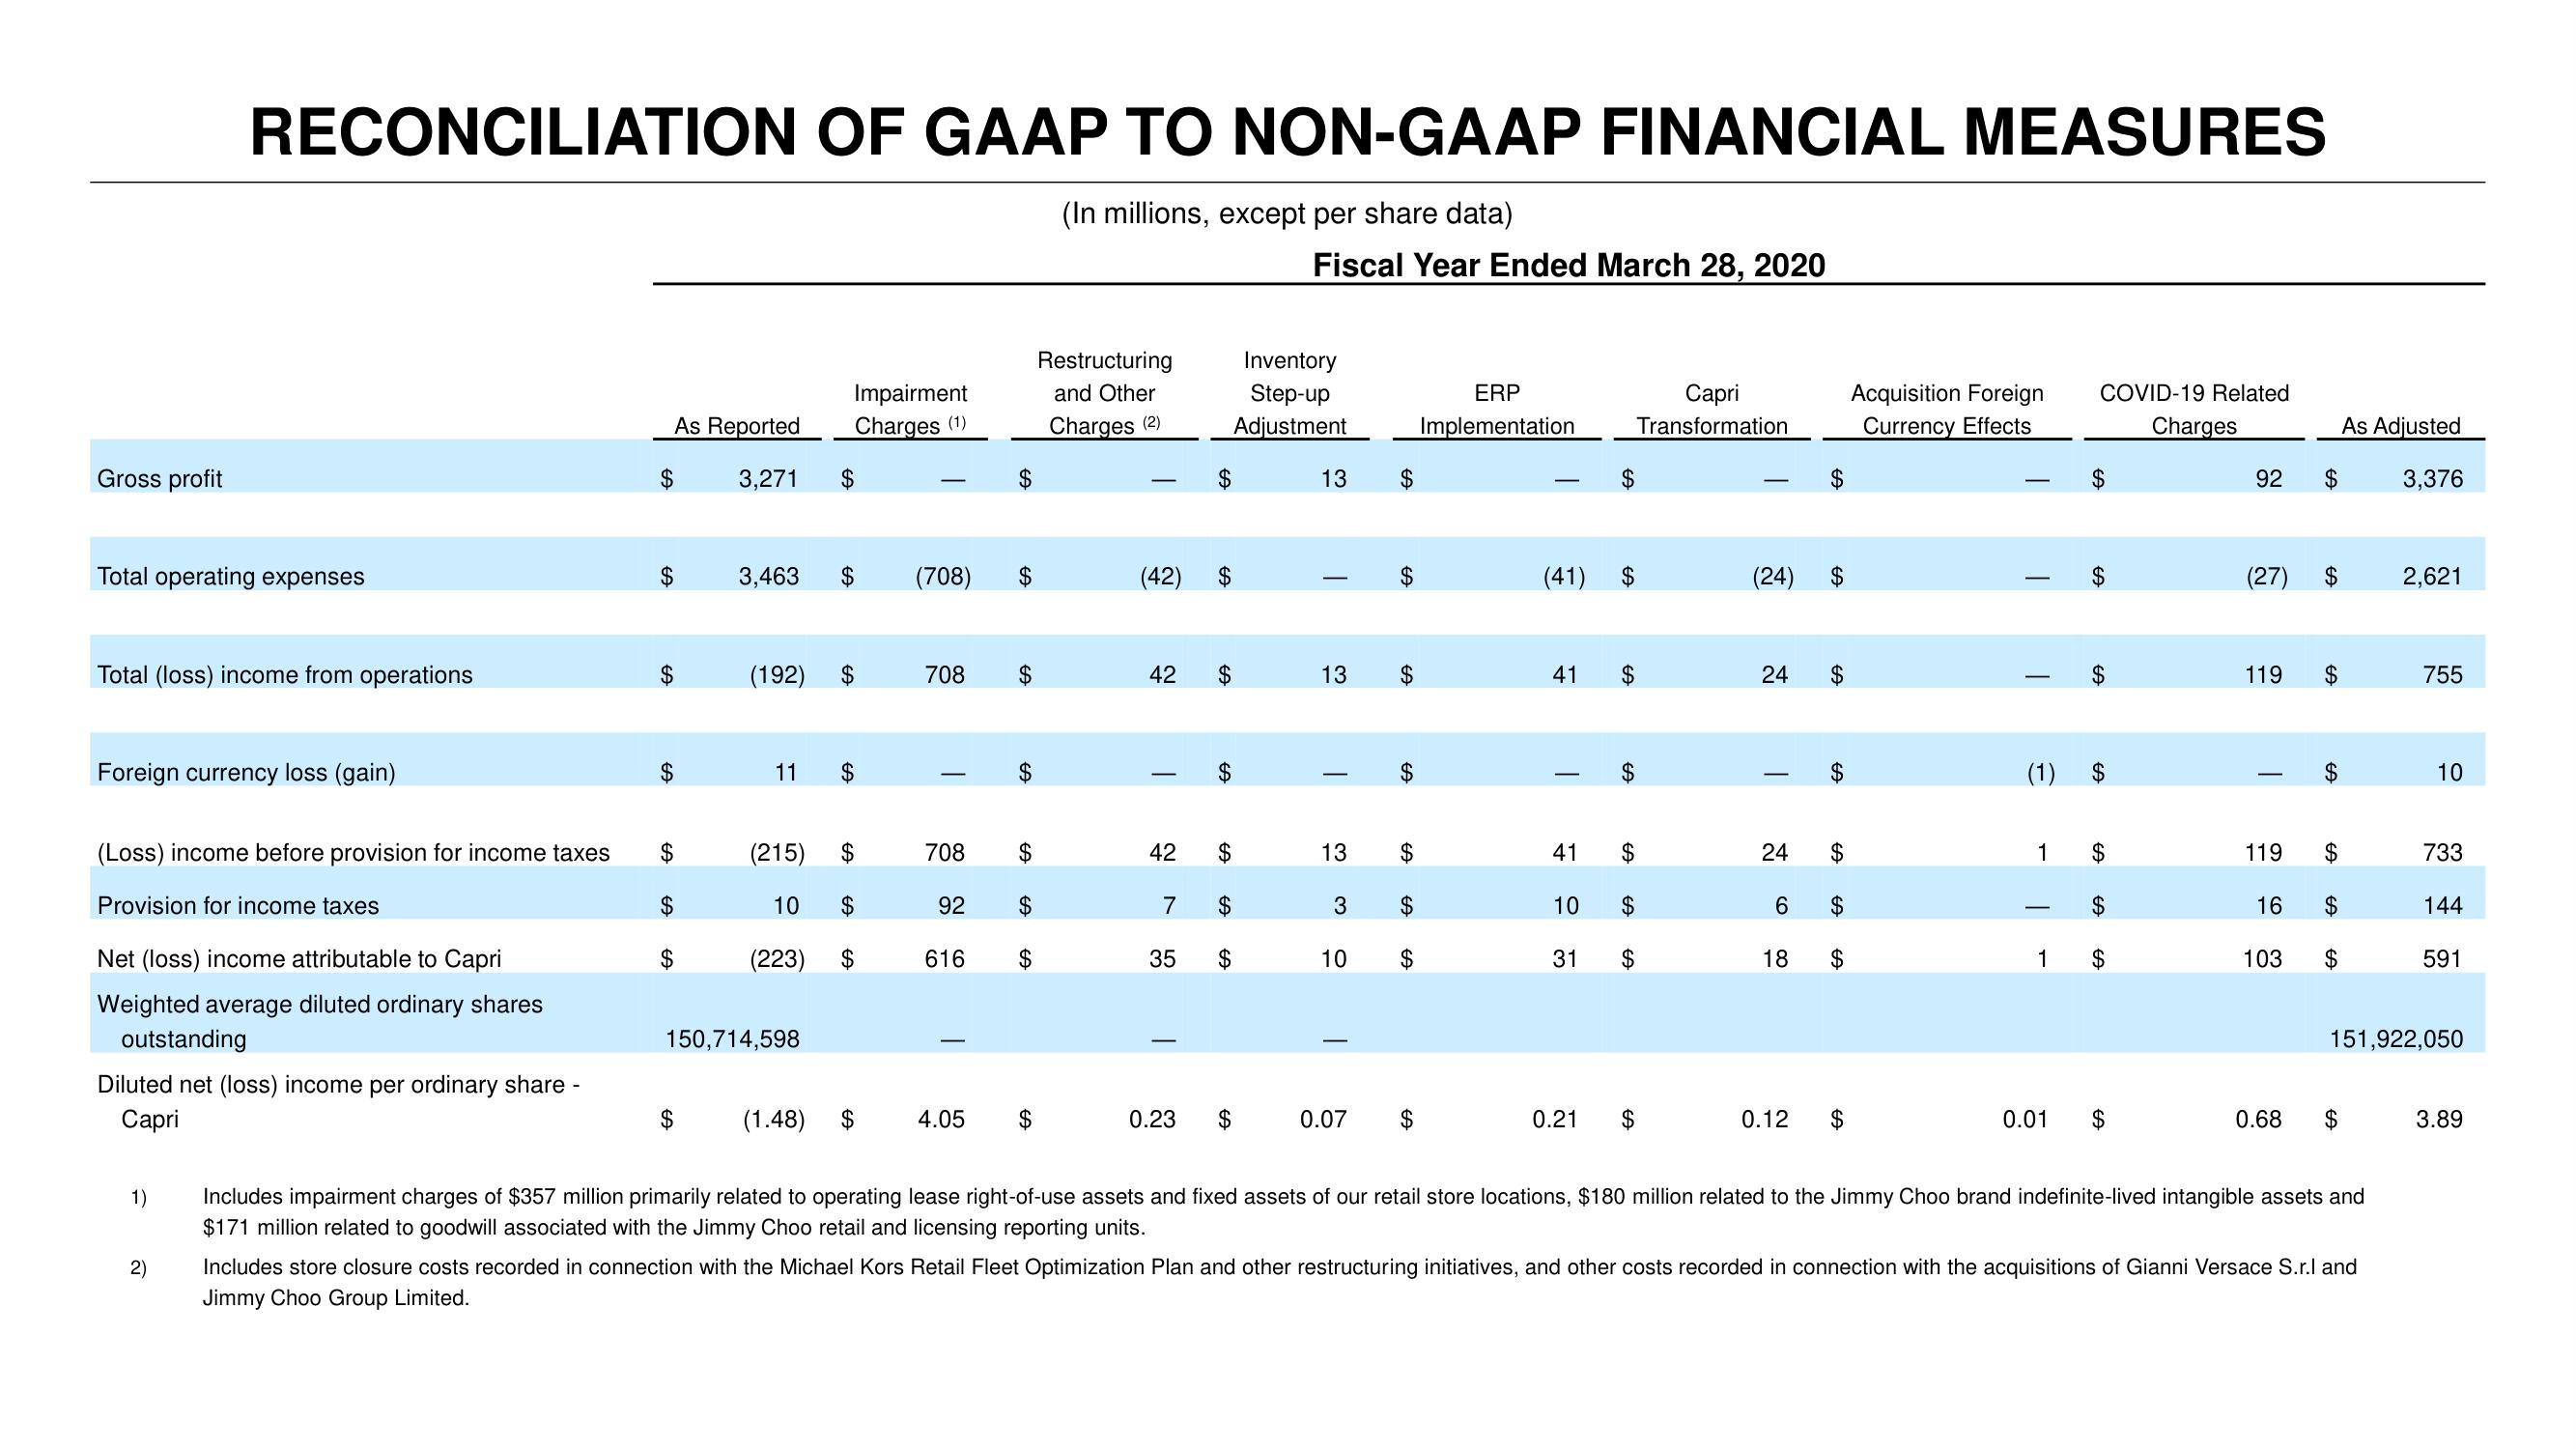
Gross profit
Total operating expenses
RECONCILIATION OF GAAP TO NON-GAAP FINANCIAL MEASURES
(In millions, except per share data)
Total (loss) income from operations
Foreign currency loss (gain)
(Loss) income before provision for income taxes
Provision for income taxes
Net (loss) income attributable to Capri
Weighted average diluted ordinary shares
outstanding
Diluted net (loss) income per ordinary share -
Capri
1)
2)
$
As Reported
3,271
$
3,463
$
(192)
11
(215)
10
(223)
150,714,598
(1.48)
Impairment
Charges (1)
$
$
GA
GA
(708)
T
708 $
92
$
616
$
708 $
4.05
$
$
$
$
Restructuring
and Other
Charges (2)
(42) $
T
42 $
42
$
7
35
GA
$
GA
$
$
EA
Inventory
Step-up
Adjustment
0.23 $
Fiscal Year Ended March 28, 2020
13 $
I
$
13 $
FA
0.07
FA
13 $
3
$
10
$
$
ERP
Implementation
(41)
41 $
T
41
10
31
0.21
$
SA
$
Capri
Transformation
$
$
(24) $
24
T
24
6
CO
$
18
$
$
$
$
$
0.12 $
Acquisition Foreign
Currency Effects
I
(1)
1
COVID-19 Related
0.01
$
GA
SA
GA
1 $
$
Charges
92
(27)
119 $
119
16
103
CA
$
$
As Adjusted
3,376
0.68 $
Includes impairment charges of $357 million primarily related to operating lease right-of-use assets and fixed assets of our retail store locations, $180 million related to the Jimmy Choo brand indefinite-lived intangible assets and
$171 million related to goodwill associated with the Jimmy Choo retail and licensing reporting units.
2,621
Includes store closure costs recorded in connection with the Michael Kors Retail Fleet Optimization Plan and other restructuring initiatives, and other costs recorded in connection with the acquisitions of Gianni Versace S.r.l and
Jimmy Choo Group Limited.
755
151,922,050
10
733
144
591
3.89View entire presentation