Signify Health Investor Presentation Deck
-->Financial highlights
Zin
signifyhealth.
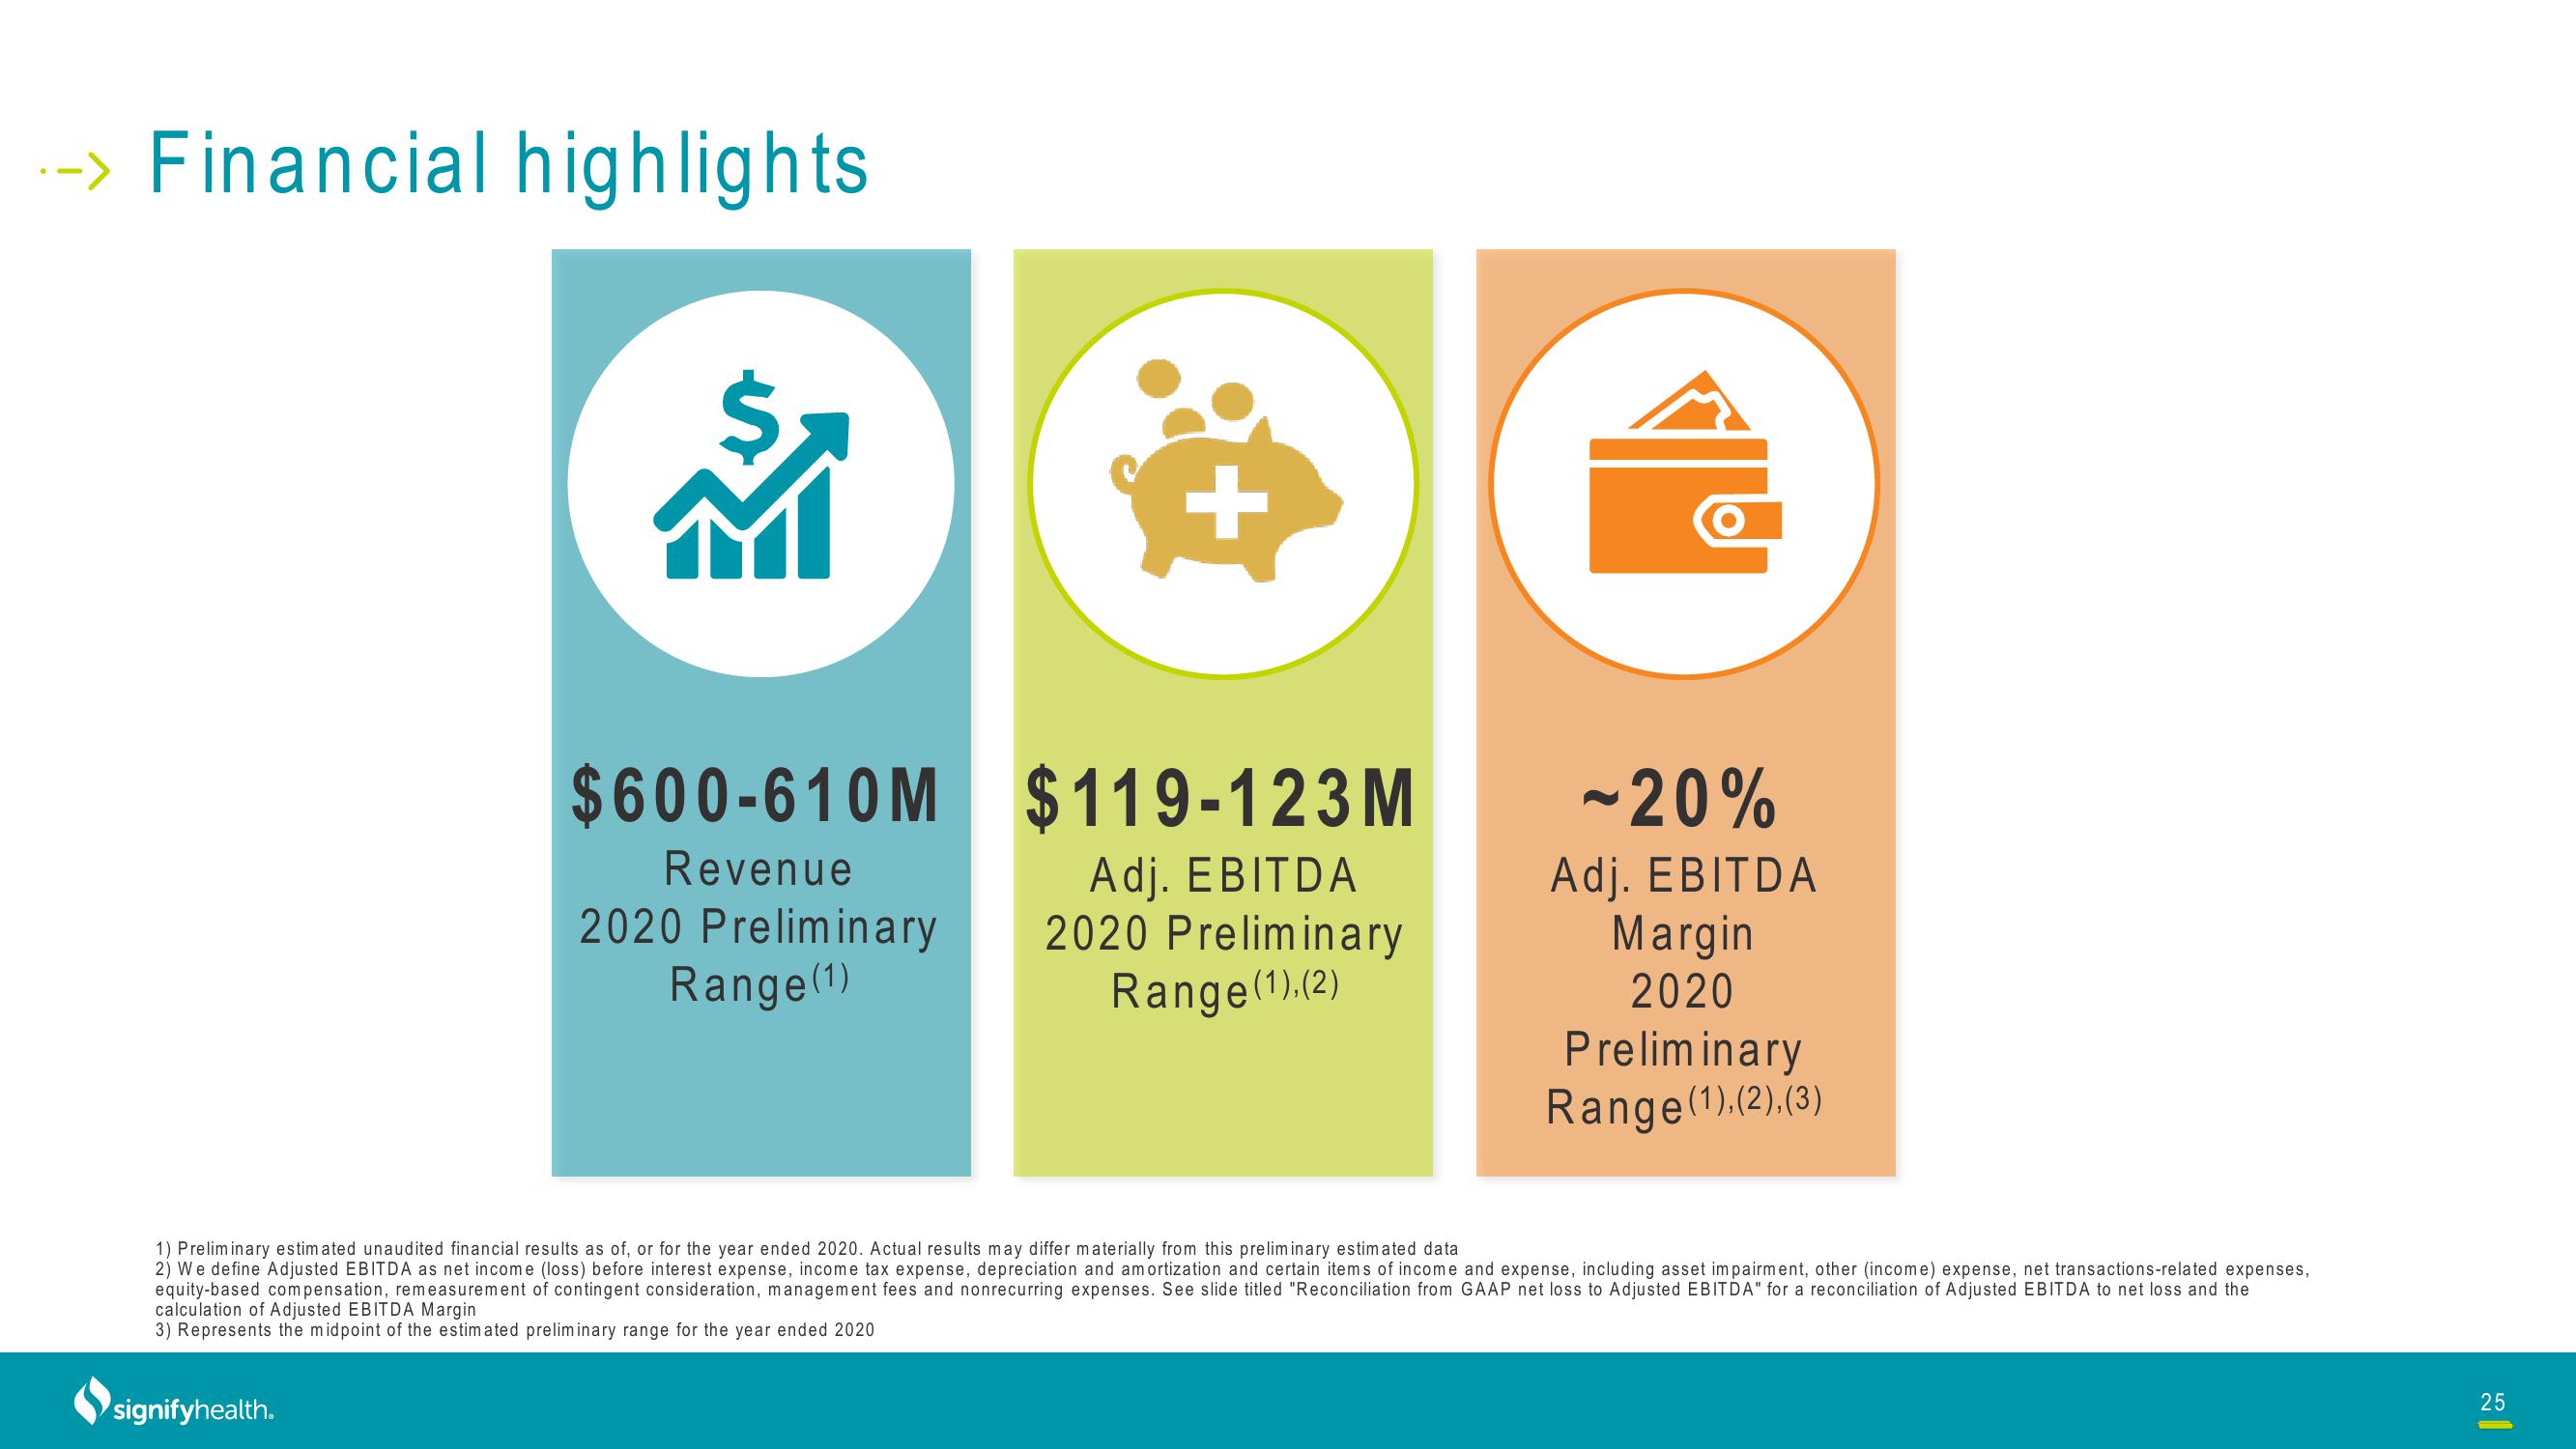
$600-610M
Revenue
2020 Preliminary
Range (¹)
$119-123M
Adj. EBITDA
2020 Preliminary
Range (1), (2)
-20%
Adj. EBITDA
Margin
2020
Preliminary
Range(1), (2), (3)
1) Preliminary estimated unaudited financial results as of, or for the year ended 2020. Actual results may differ materially from this preliminary estimated data
2) We define Adjusted EBITDA as net income (loss) before interest expense, income tax expense, depreciation and amortization and certain items of income and expense, including asset impairment, other (income) expense, net transactions-related expenses,
equity-based compensation, remeasurement of contingent consideration, management fees and nonrecurring expenses. See slide titled "Reconciliation from GAAP net loss to Adjusted EBITDA" for a reconciliation of Adjusted EBITDA to net loss and the
calculation of Adjusted EBITDA Margin
3) Represents the midpoint of the estimated preliminary range for the year ended 2020
25View entire presentation