Azerion SPAC Presentation Deck
Summary of historic financials
Income statement
€m
Platform revenue
o/w Premium Games
o/w Remaining platform
COGS
Gross profit
Opex
Reported EBITDA
Classification amendments
Management adjustments
Adj. EBITDA
azerion
2019
173
32
141
(118)
55
(44)
11¹
15
2020
195
44
151
(125)
70
(48)
22
LO
5
26
2
H1 2021
98
22
76
(62)
36
(29)
6³
3
10
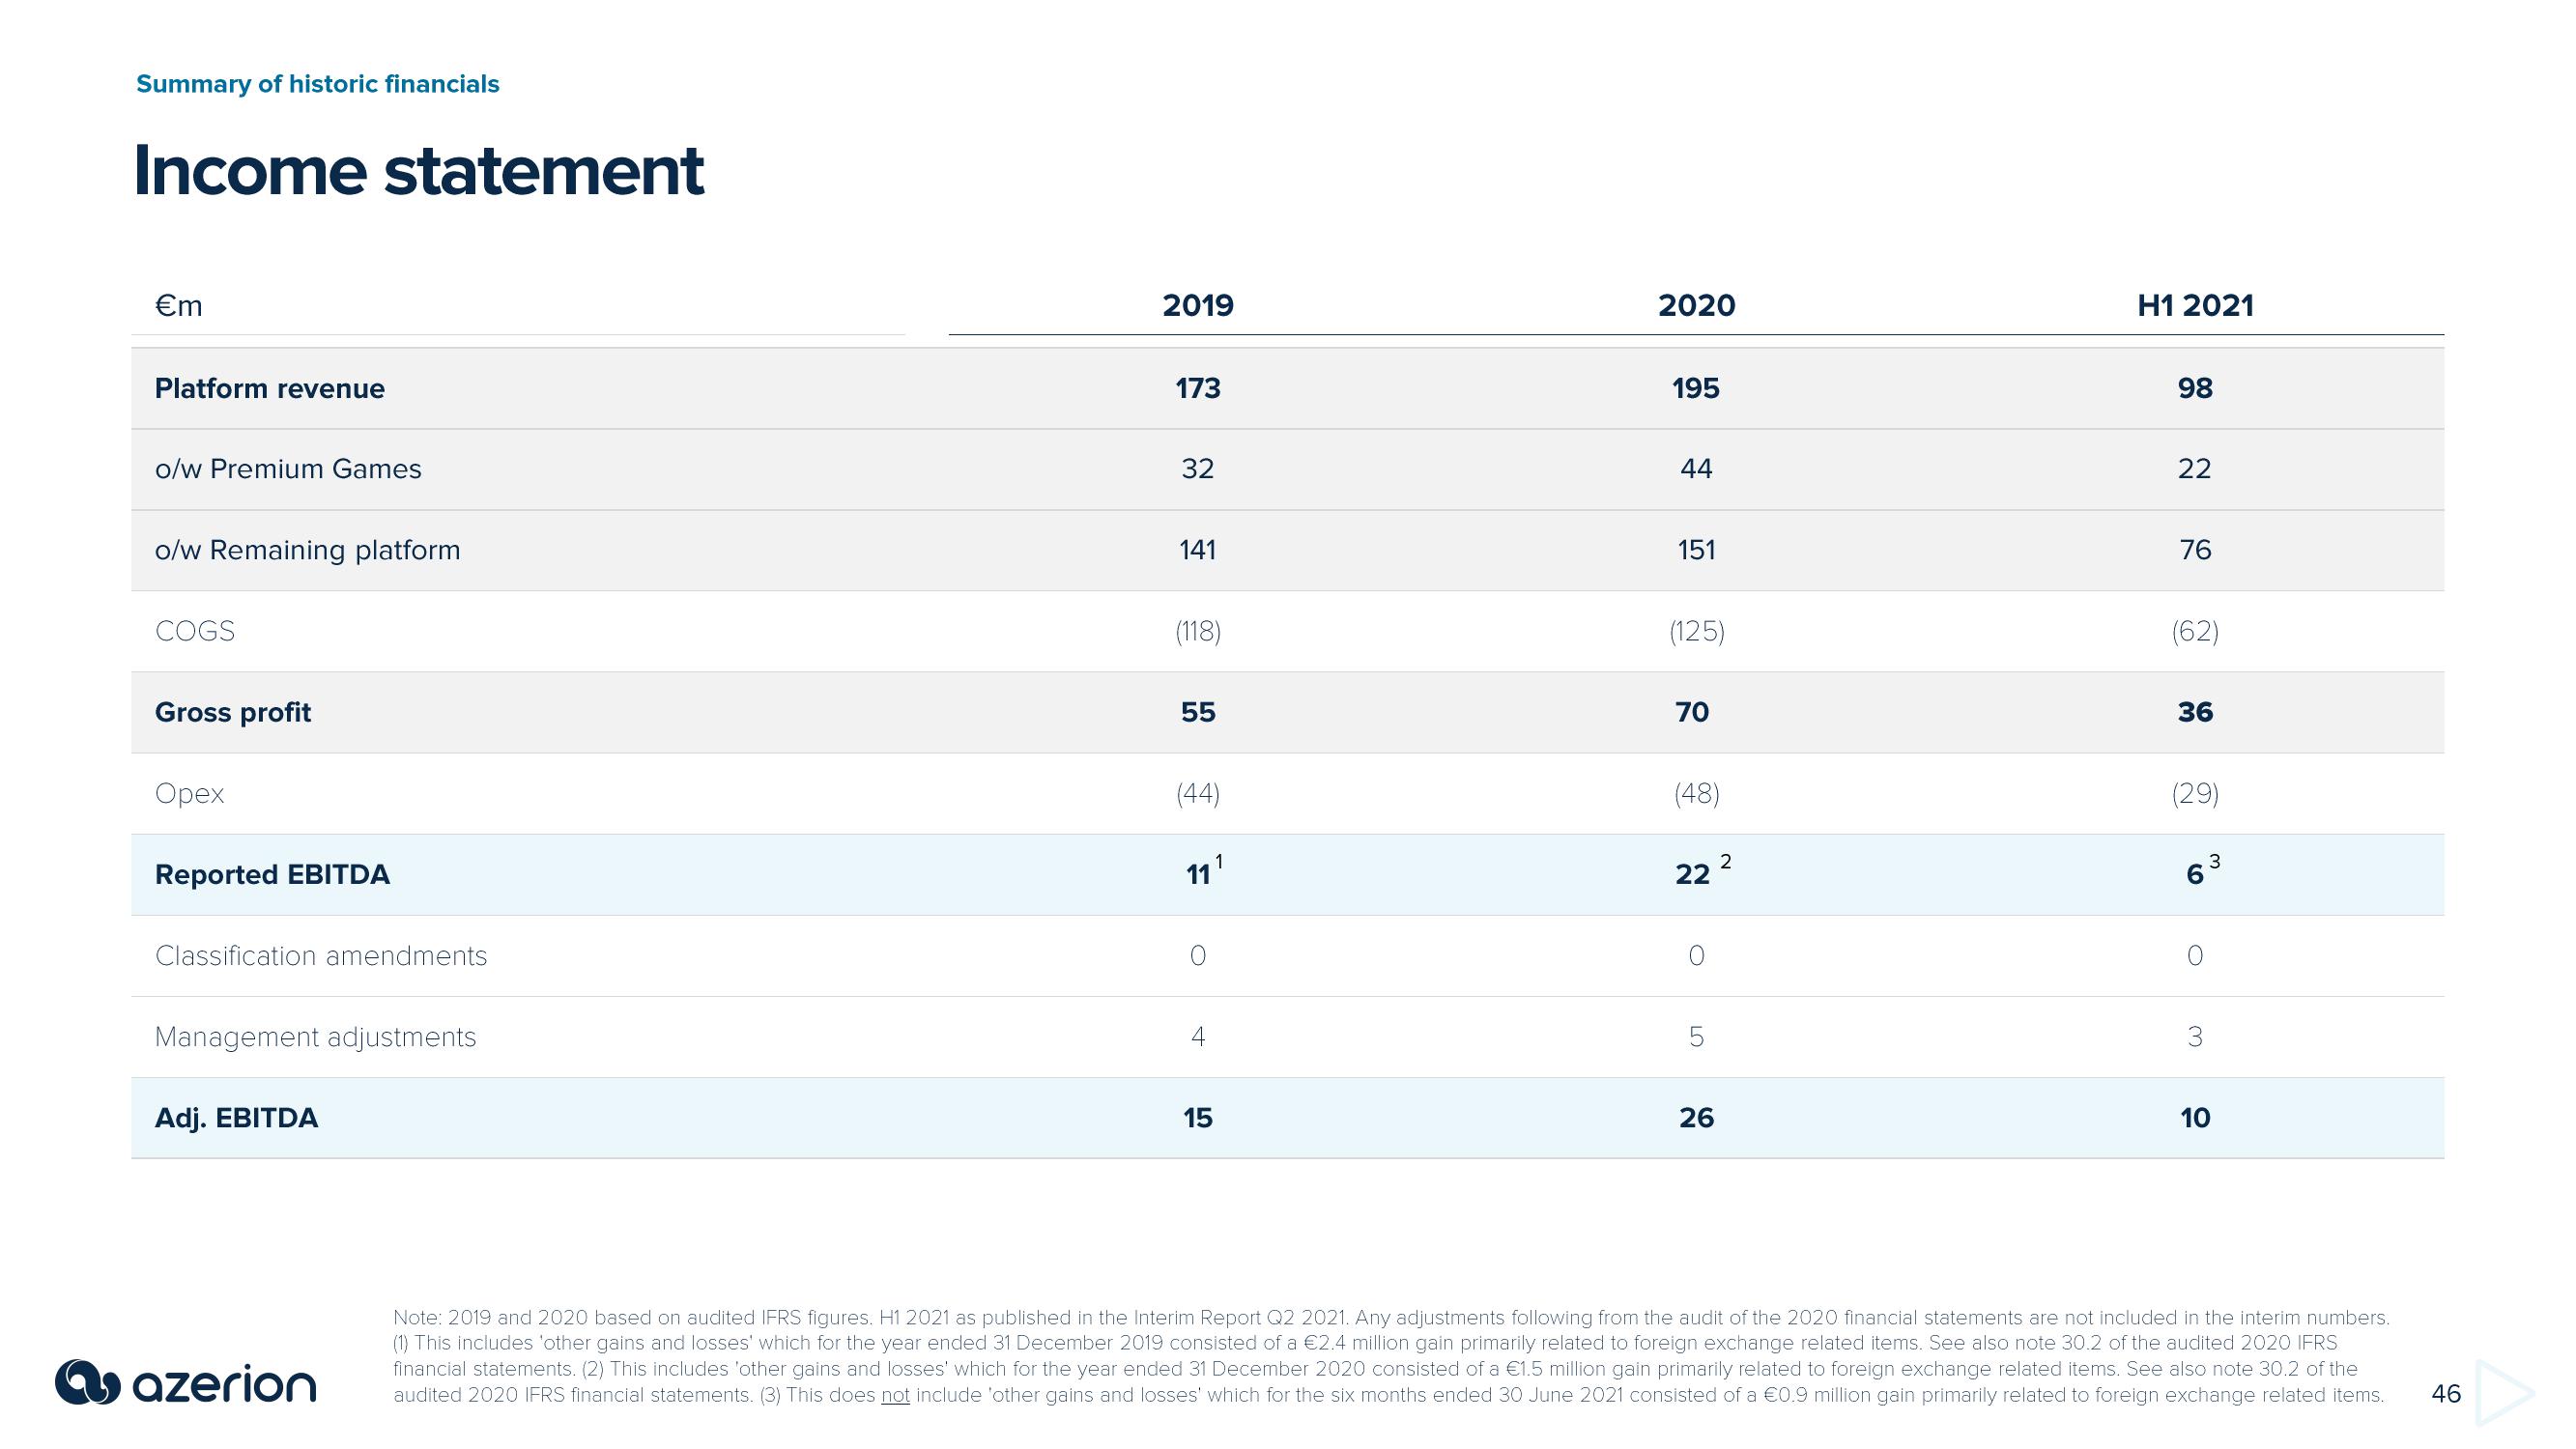
Note: 2019 and 2020 based on audited IFRS figures. H1 2021 as published in the Interim Report Q2 2021. Any adjustments following from the audit of the 2020 financial statements are not included in the interim numbers.
(1) This includes 'other gains and losses' which for the year ended 31 December 2019 consisted of a €2.4 million gain primarily related to foreign exchange related items. See also note 30.2 of the audited 2020 IFRS
financial statements. (2) This includes 'other gains and losses' which for the year ended 31 December 2020 consisted of a €1.5 million gain primarily related to foreign exchange related items. See also note 30.2 of the
audited 2020 IFRS financial statements. (3) This does not include 'other gains and losses' which for the six months ended 30 June 2021 consisted of a €0.9 million gain primarily related to foreign exchange related items.
46View entire presentation