Affirm Results Presentation Deck
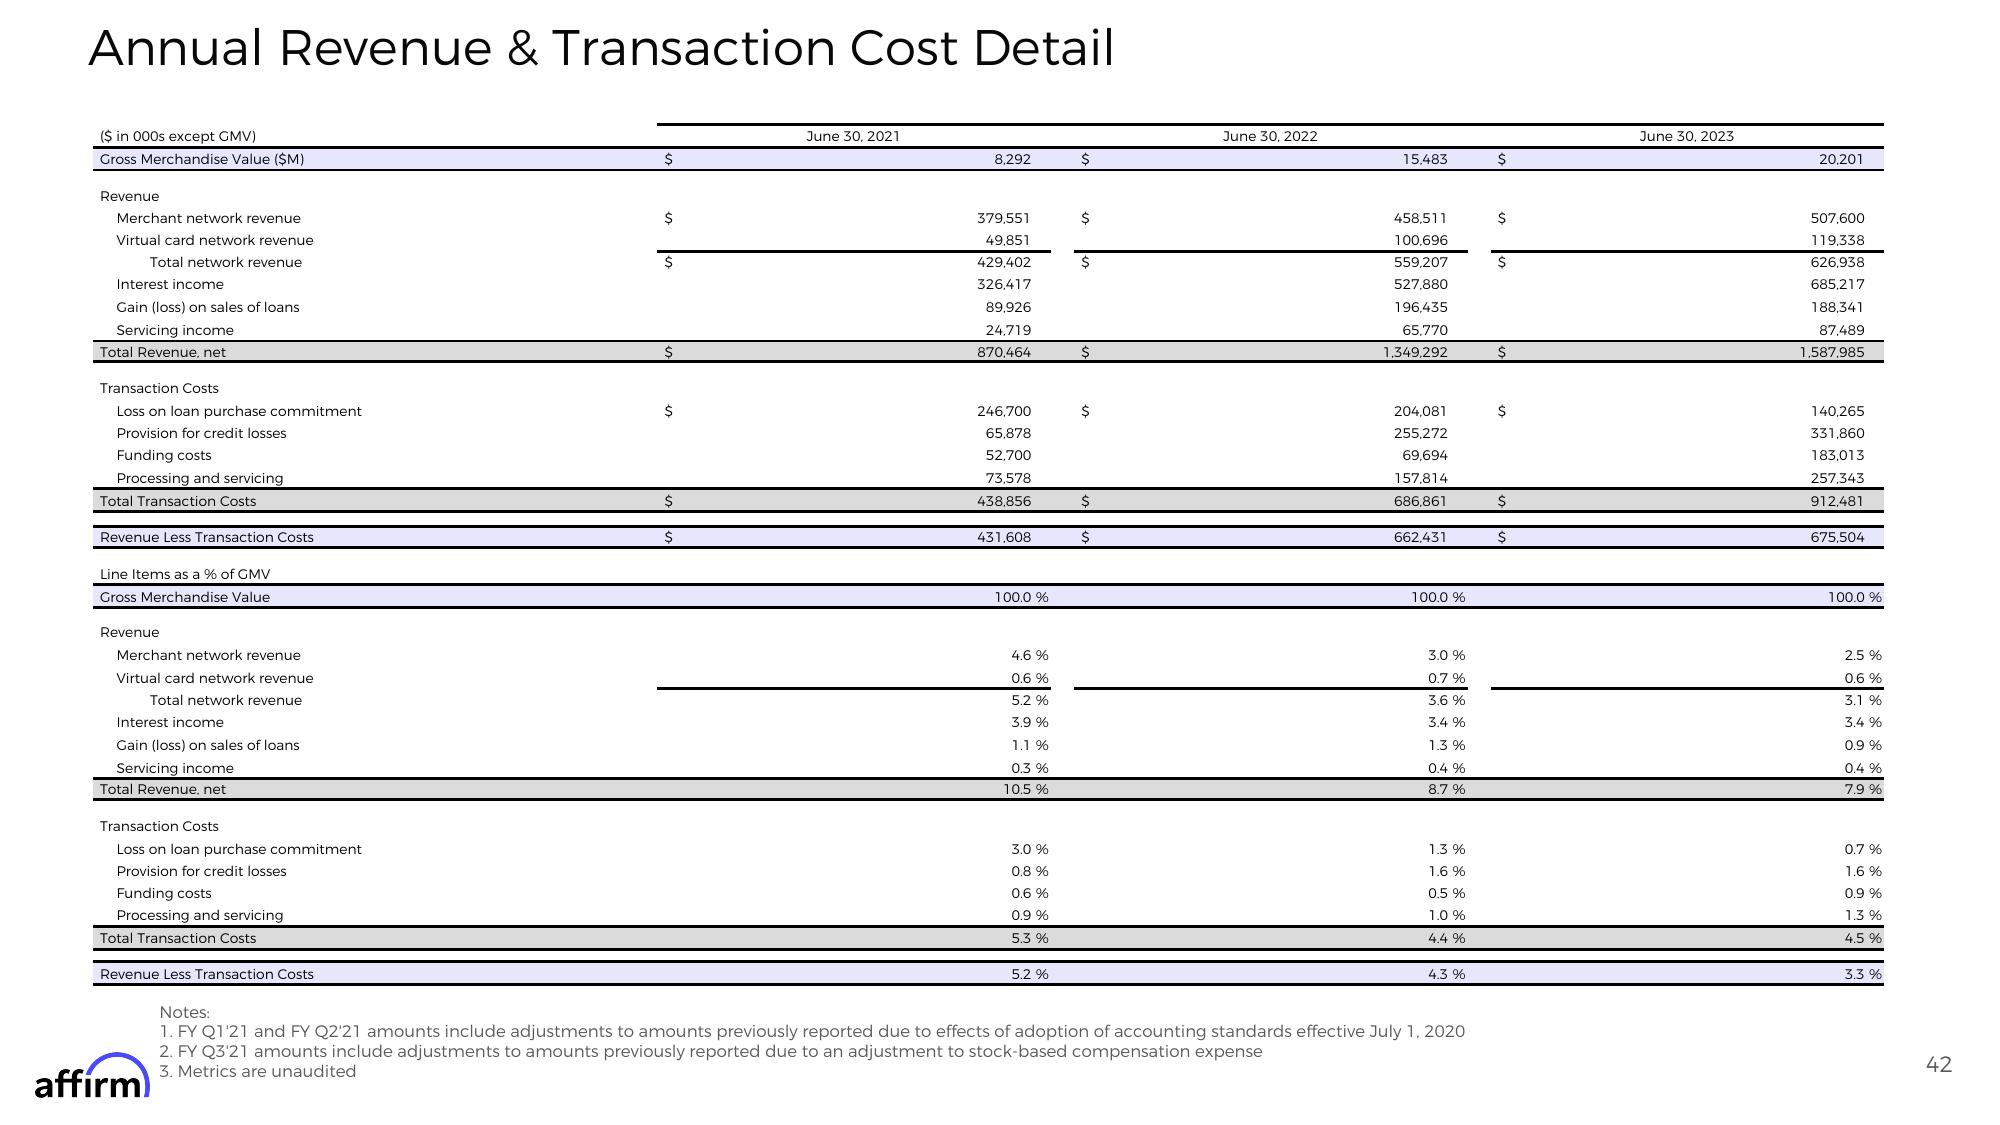
Annual Revenue & Transaction Cost Detail
($ in 000s except GMV)
Gross Merchandise Value ($M)
Revenue
Merchant network revenue
Virtual card network revenue
Total network revenue
Interest income
Gain (loss) on sales of loans
Servicing income
Total Revenue, net
Transaction Costs
Loss on loan purchase commitment
Provision for credit losses
Funding costs
Processing and servicing
Total Transaction Costs
Revenue Less Transaction Costs
Line Items as a % of GMV
Gross Merchandise Value
Revenue
Merchant network revenue
Virtual card network revenue
Total network revenue
Interest income
Gain (loss) on sales of loans
Servicing income
Total Revenue, net
Transaction Costs
Loss on loan purchase commitment.
Provision for credit losses
Funding costs
Processing and servicing
Total Transaction Costs
Revenue Less Transaction Costs
affirm
$
$
$
$
$
June 30, 2021
8,292
379,551
49,851
429,402
326,417
89,926
24,719
870.464
246,700
65.878
52,700
73,578
438,856
431,608
100.0 %
4.6 %
0.6 %
5.2 %
3.9 %
1.1 %
0.3 %
10.5 %
3.0 %
0.8 %
0.6 %
0.9 %
5.3 %
5.2 %
$
$
Ś
$
$
$
$
June 30, 2022
15.483
458,511
100,696
559,207
527,880
196,435
65,770
1,349,292
204,081
255,272
69,694
157,814
686,861
662,431
100.0 %
3.0 %
0.7 %
3.6%
3.4 %
1.3%
0.4 %
8.7 %
1.3 %
1.6 %
0.5 %
1.0 %
4.4%
4.3 %
Notes:
1. FY Q1'21 and FY Q2'21 amounts include adjustments to amounts previously reported due to effects of adoption of accounting standards effective July 1, 2020
2. FY Q3'21 amounts include adjustments to amounts previously reported due to an adjustment to stock-based compensation expense
3. Metrics are unaudited
S
$
$
$
$
$
$
June 30, 2023
20,201
507,600
119,338
626,938
685,217
188,341
87,489
1,587,985
140,265
331,860
183,013
257,343
912,481
675,504
100.0 %
2.5 %
0.6 %
3.1 %
3.4 %
0.9 %
0.4 %
7.9 %
0.7 %
1.6 %
0.9 %
1.3 %
4.5 %
3.3 %
42View entire presentation