Pershing Square Activist Presentation Deck
B. PF McDonald's Financial Analysis
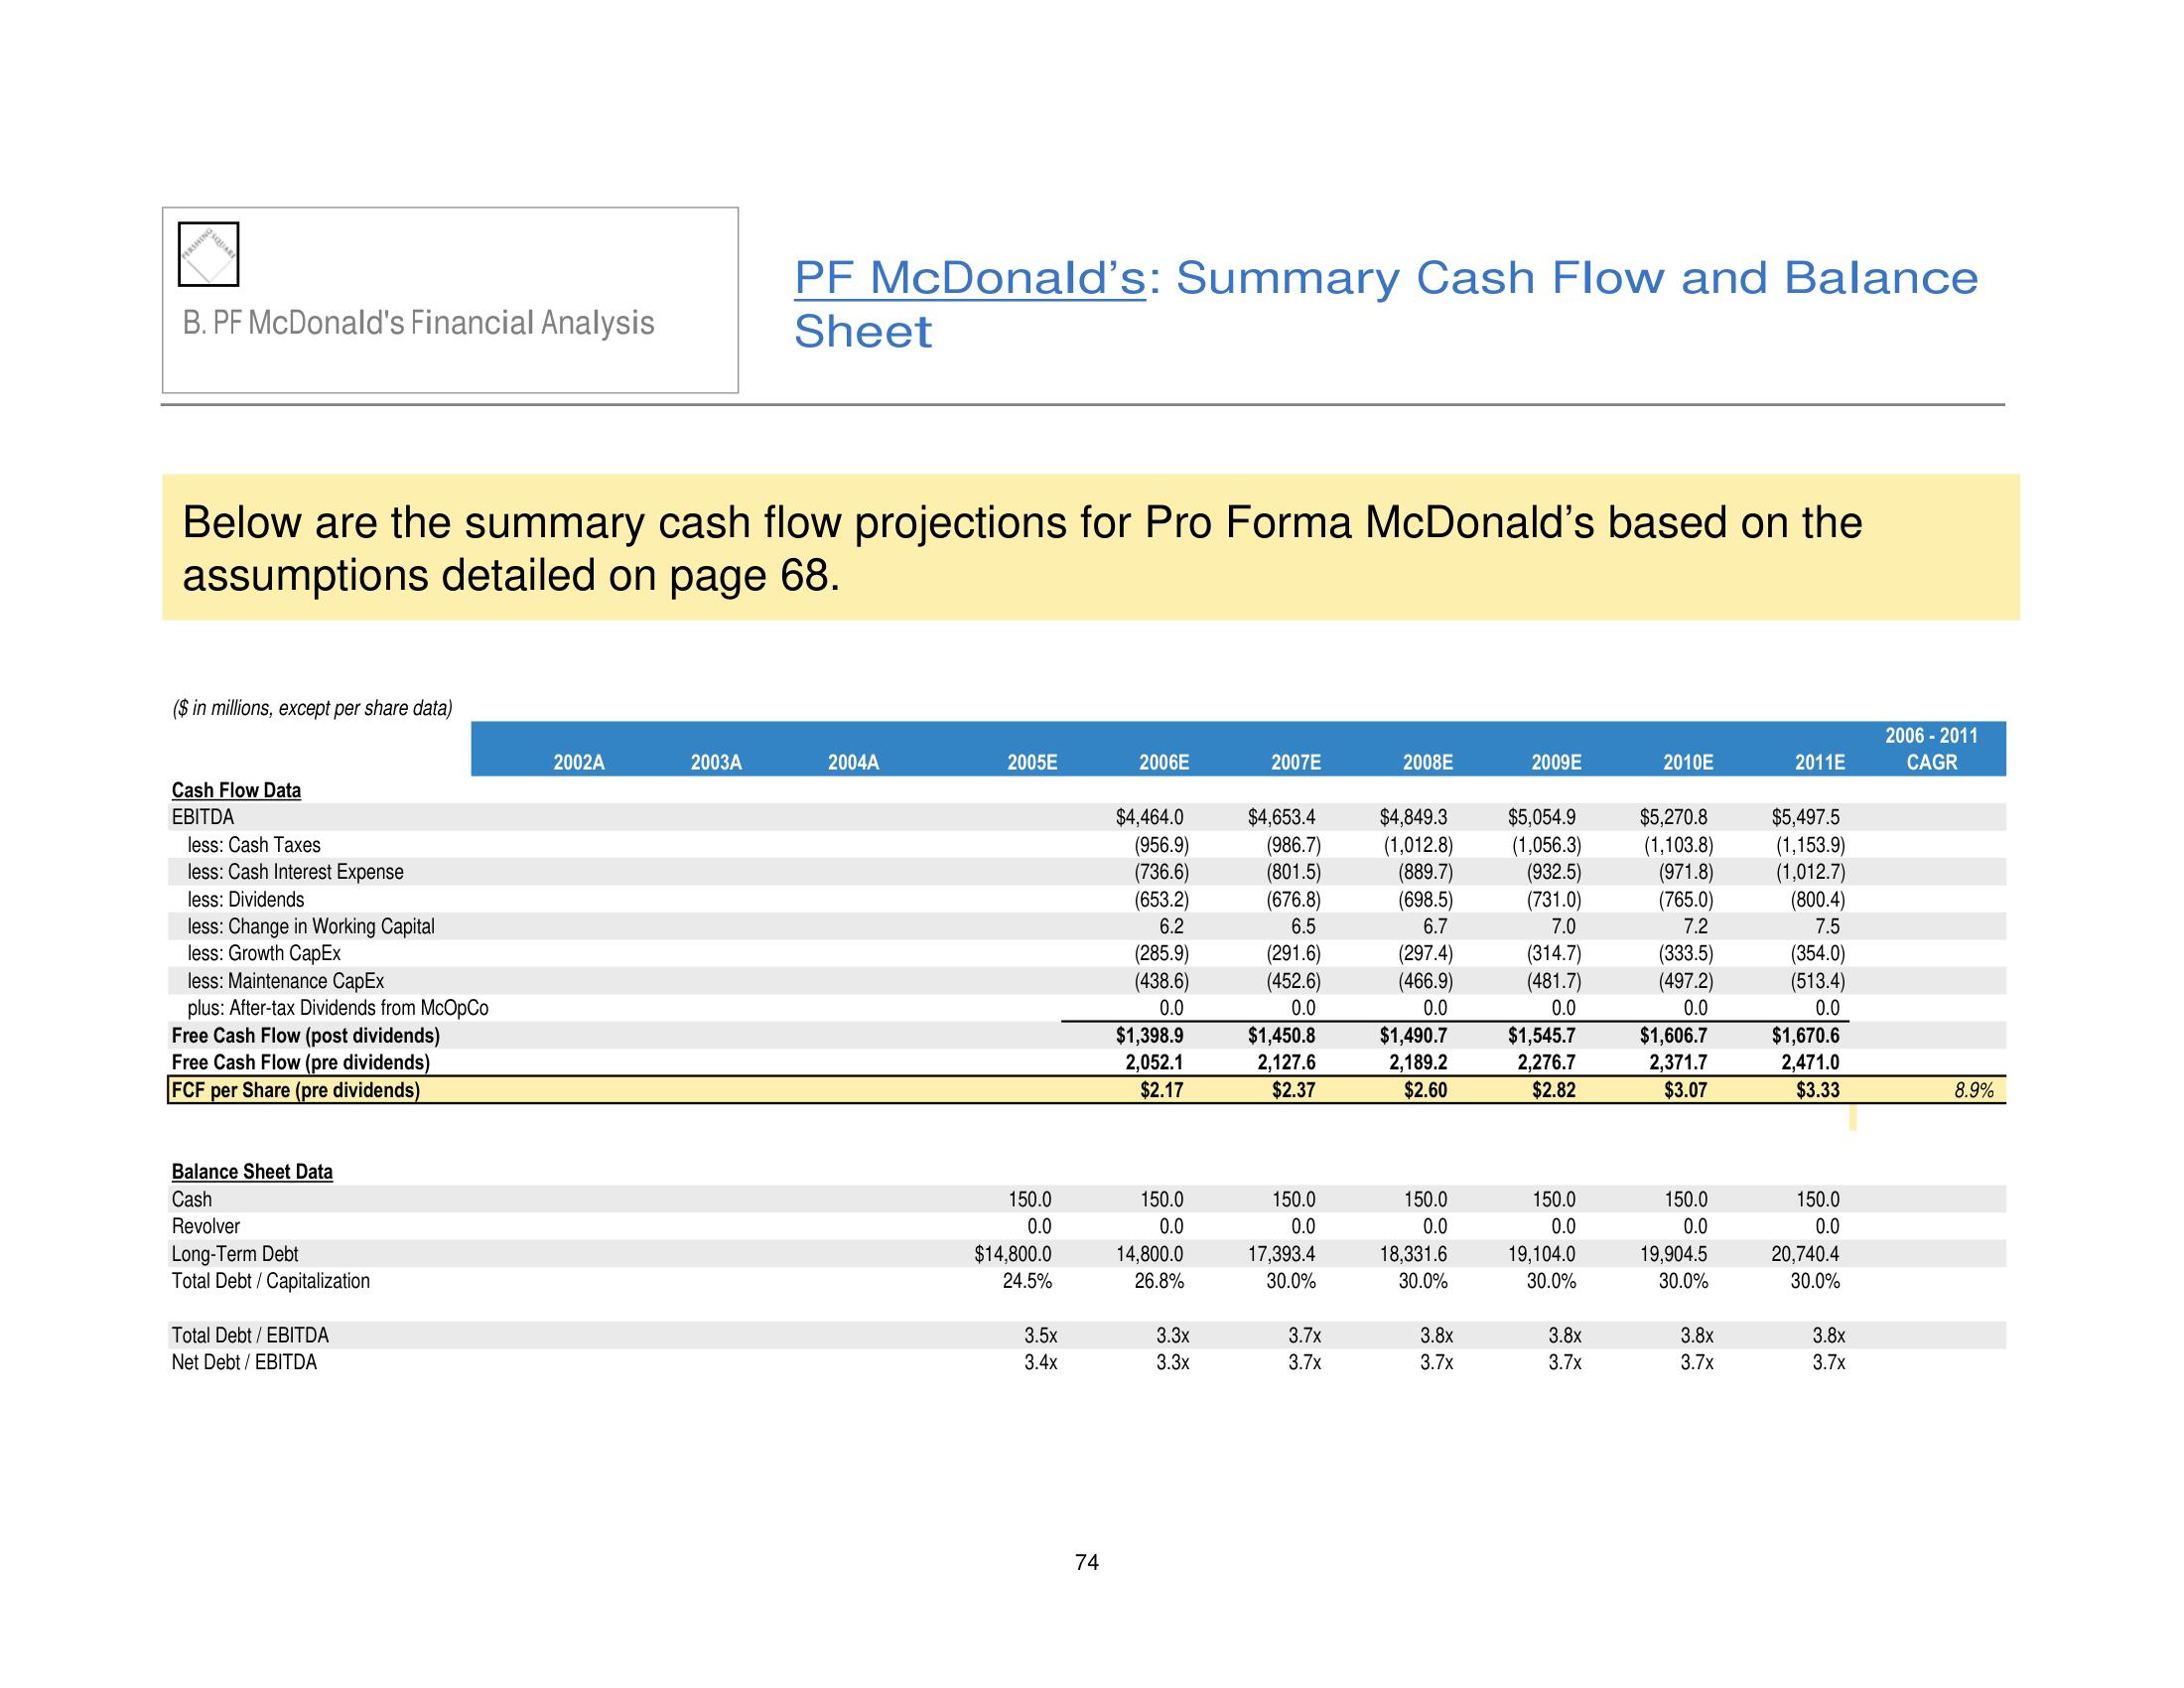
Below are the summary cash flow projections for Pro Forma McDonald's based on the
assumptions detailed on page 68.
($ in millions, except per share data)
Cash Flow Data
EBITDA
less: Cash Taxes
less: Cash Interest Expense
less: Dividends
less: Change in Working Capital
less: Growth CapEx
less: Maintenance CapEx
plus: After-tax Dividends from McOpCo
Free Cash Flow (post dividends)
Free Cash Flow (pre dividends)
FCF per Share (pre dividends)
Balance Sheet Data
Cash
Revolver
Long-Term Debt
Total Debt / Capitalization
Total Debt / EBITDA
Net Debt / EBITDA
2002A
PF McDonald's: Summary Cash Flow and Balance
Sheet
2003A
2004A
2005E
150.0
0.0
$14,800.0
24.5%
3.5x
3.4x
74
2006E
$4,464.0
(956.9)
(736.6)
(653.2)
6.2
(285.9)
(438.6)
0.0
$1,398.9
2,052.1
$2.17
150.0
0.0
14,800.0
26.8%
3.3x
3.3x
2007E
$4,653.4
(986.7)
(801.5)
(676.8)
6.5
(291.6)
(452.6)
0.0
$1,450.8
2,127.6
$2.37
150.0
0.0
17,393.4
30.0%
3.7x
3.7x
2008E
$4,849.3
(1,012.8)
(889.7)
(698.5)
6.7
(297.4)
(466.9)
0.0
$1,490.7
2,189.2
$2.60
150.0
0.0
18,331.6
30.0%
3.8x
3.7x
2009E
$5,054.9
(1,056.3)
(932.5)
(731.0)
7.0
(314.7)
(481.7)
0.0
$1,545.7
2,276.7
$2.82
150.0
0.0
19,104.0
30.0%
3.8x
3.7x
2010E
$5,270.8
(1,103.8)
(971.8)
(765.0)
7.2
(333.5)
(497.2)
0.0
$1,606.7
2,371.7
$3.07
150.0
0.0
19,904.5
30.0%
3.8x
3.7x
2011E
$5,497.5
(1,153.9)
(1,012.7)
(800.4)
7.5
(354.0)
(513.4)
0.0
$1,670.6
2,471.0
$3.33
150.0
0.0
20,740.4
30.0%
3.8x
3.7x
2006 - 2011
CAGR
8.9%View entire presentation