Massachusetts Water Resources Authority (“MWRA”) Employees’ Retirement System
Baxter Street Performance Summary
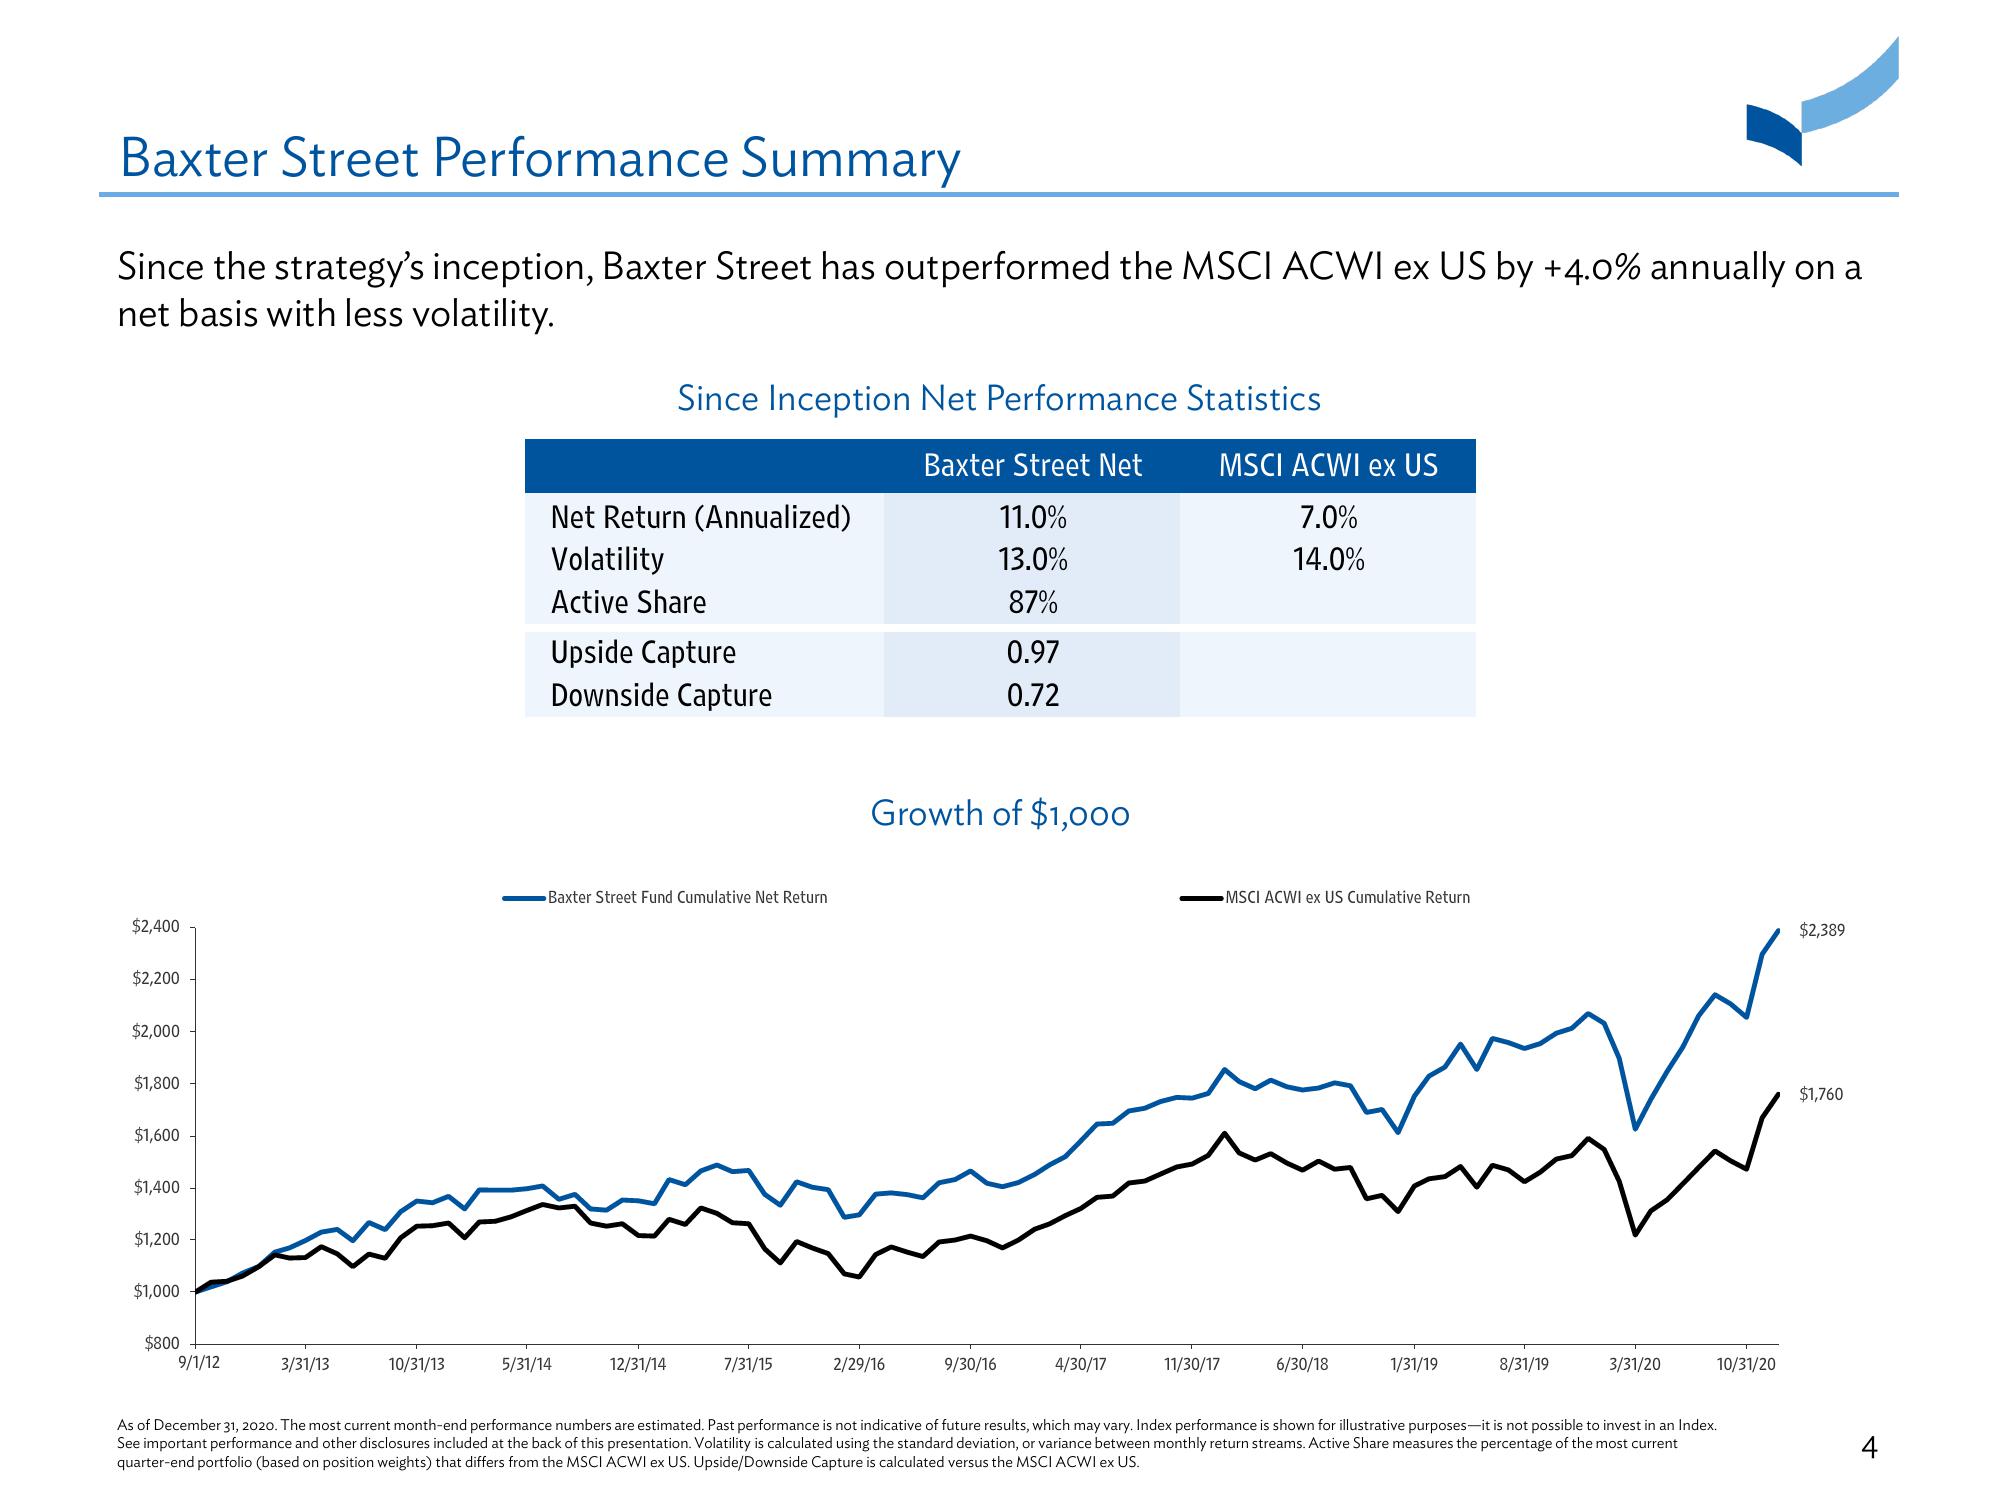
Since the strategy's inception, Baxter Street has outperformed the MSCI ACWI ex US by +4.0% annually on a
net basis with less volatility.
$2,400
$2,200
$2,000
$1,800
$1,600
$1,400
$1,200
$1,000
$800
9/1/12
3/31/13
10/31/13
Net Return (Annualized)
Volatility
Active Share
Since Inception Net Performance Statistics
Baxter Street Net
11.0%
13.0%
87%
Upside Capture
Downside Capture
Baxter Street Fund Cumulative Net Return
5/31/14
12/31/14
7/31/15
Growth of $1,000
2/29/16
0.97
0.72
9/30/16
4/30/17
MSCI ACWI ex US
7.0%
14.0%
11/30/17
MSCI ACWI ex US Cumulative Return
6/30/18
1/31/19
8/31/19
3/31/20
10/31/20
As of December 31, 2020. The most current month-end performance numbers are estimated. Past performance is not indicative of future results, which may vary. Index performance is shown for illustrative purposes-it is not possible to invest in an Index.
See important performance and other disclosures included at the back of this presentation. Volatility is calculated using the standard deviation, or variance between monthly return streams. Active Share measures the percentage of the most current
quarter-end portfolio (based on position weights) that differs from the MSCI ACWI ex US. Upside/Downside Capture is calculated versus the MSCI ACWI ex US.
$2,389
$1,760View entire presentation