Maersk Results Presentation Deck
Maersk Group
- Interim Report 03 2015
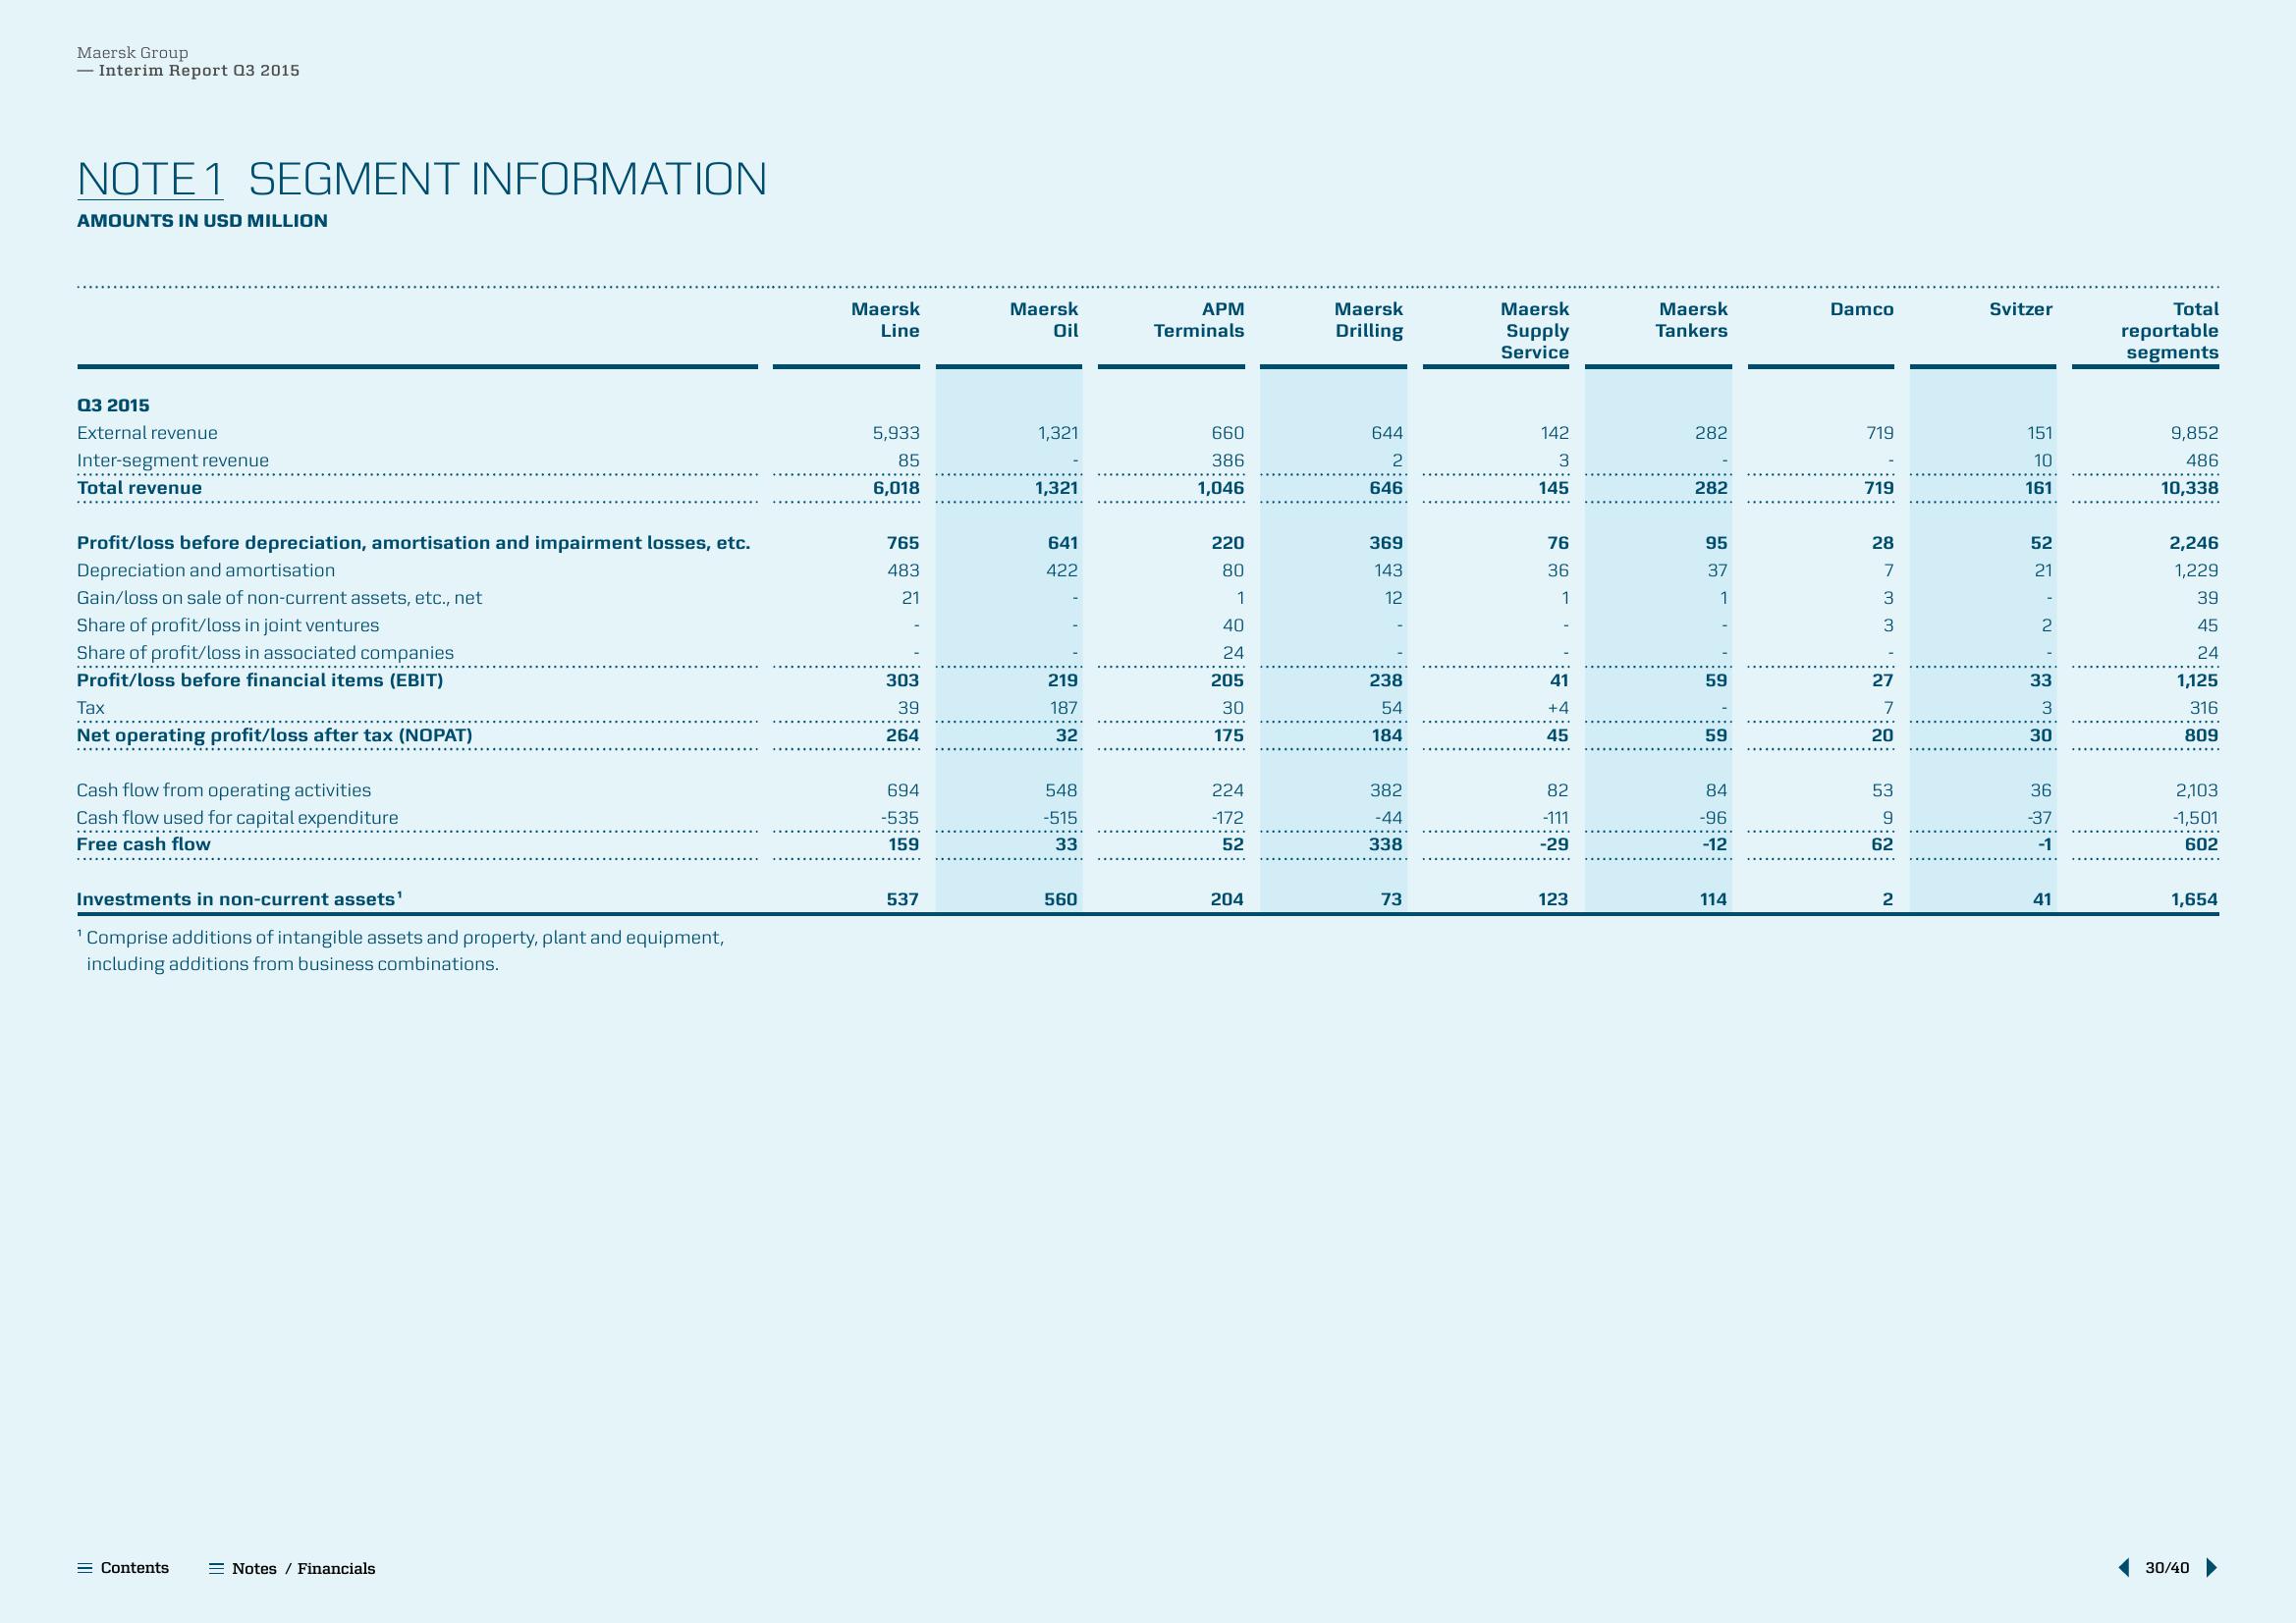
NOTE 1 SEGMENT INFORMATION
AMOUNTS IN USD MILLION
Q3 2015
External revenue
Inter-segment revenue
Total revenue
Profit/loss before depreciation, amortisation and impairment losses, etc.
Depreciation and amortisation
Gain/loss on sale of non-current assets, etc., net
Share of profit/loss in joint ventures
Share of profit/loss in associated companies
********…..…….………...
Profit/loss before financial items (EBIT)
Tax
Net operating profit/loss after tax (NOPAT)
Cash flow from operating activities
Cash flow used for capital expenditure
Free cash flow
Investments in non-current assets¹
¹ Comprise additions of intangible assets and property, plant and equipment,
including additions from business combinations.
= Contents
Notes / Financials
Maersk
Line
5,933
85
6,018
765
483
21
303
39
264
694
-535
159
537
Maersk
Oil
1,321
1,321
641
422
219
187
32
548
-515
33
560
APM
Terminals
660
386
1,046
220
80
1
40
24
205
30
175
224
-172
52
204
Maersk
Drilling
644
2
646
369
143
12
238
54
184
382
-44
338
73
Maersk
Supply
Service
142
3
145
76
36
1
41
+4
45
82
-111
-29
123
Maersk
Tankers
282
282
95
37
1
59
59
84
-96
-12
114
Damco
719
719
28
7
3
3
27
7
20
53
9
62
2
Svitzer
151
10
161
52
21
-
2
33
3
30
36
-37
-1
41
Total
reportable
segments
9,852
486
10,338
2,246
1,229
39
45
24
1,125
316
809
2,103
-1,501
602
1,654
30/40View entire presentation