LSE Results Presentation Deck
Minor business revenue reallocation
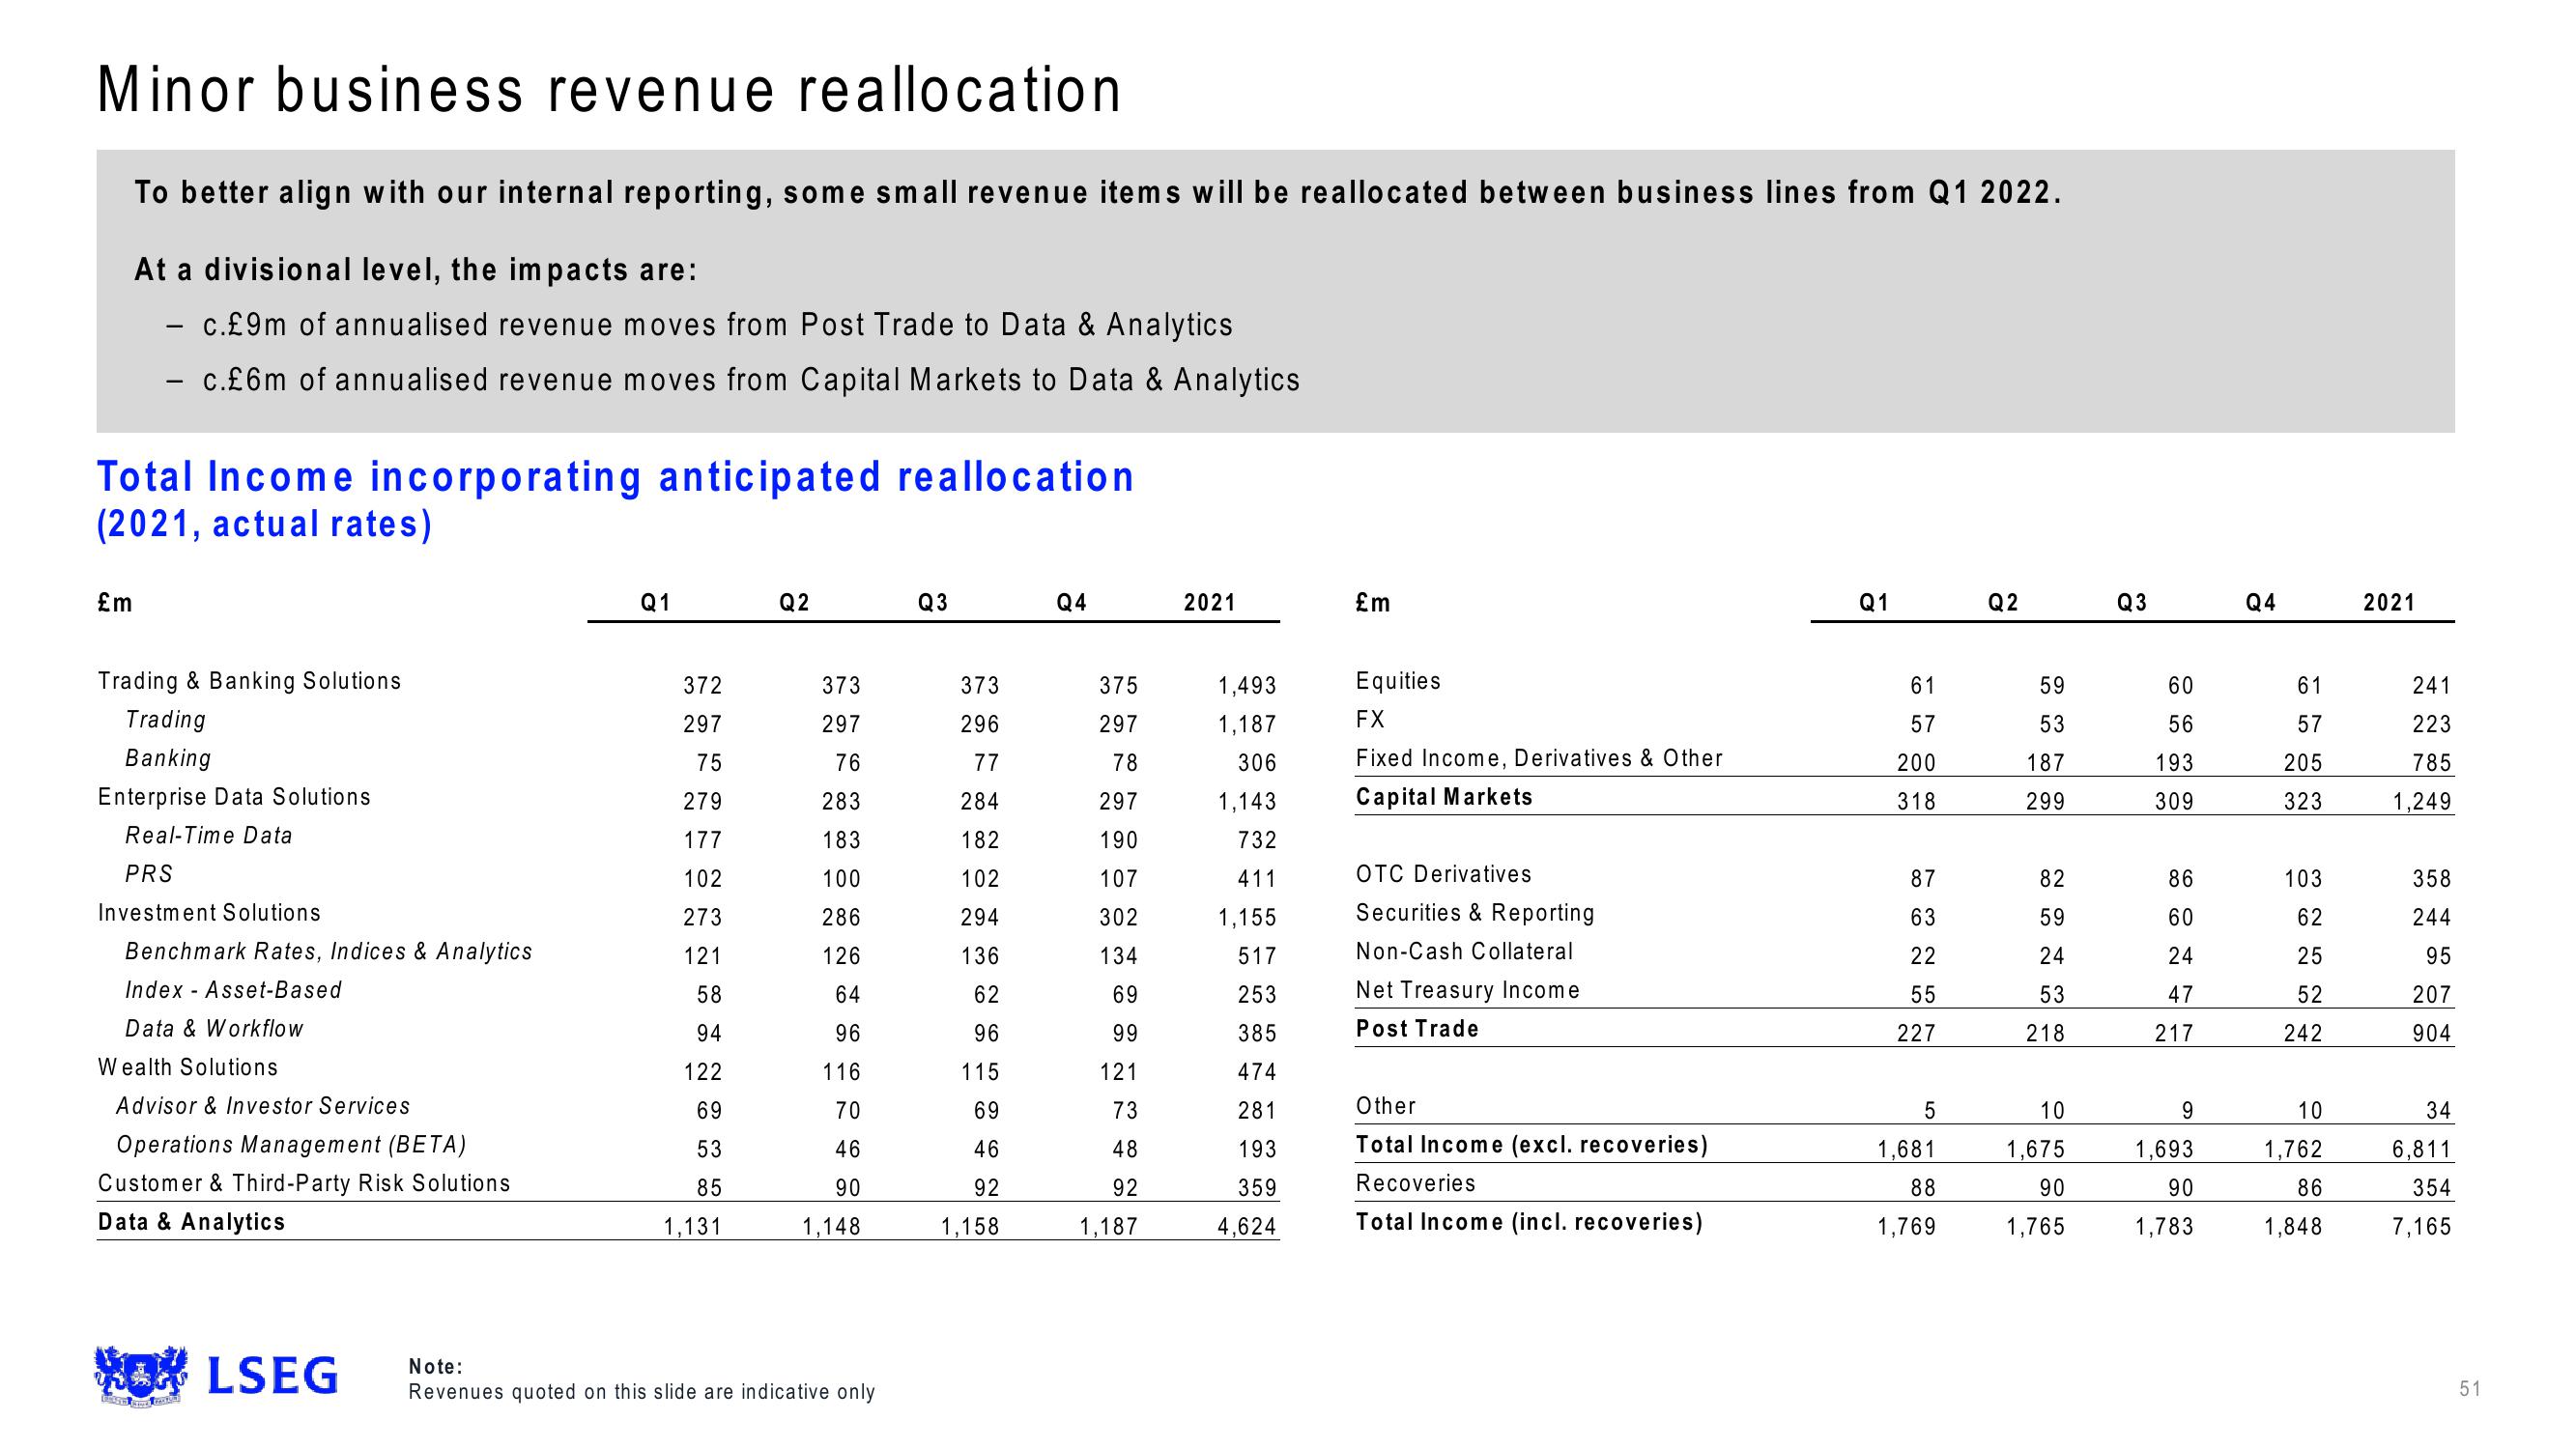
To better align with our internal reporting, some small revenue items will be reallocated between business lines from Q1 2022.
At a divisional level, the impacts are:
- c.£9m of annualised revenue moves from Post Trade to Data & Analytics
- c.£6m of annualised revenue moves from Capital Markets to Data & Analytics
Total Income incorporating anticipated reallocation
(2021, actual rates)
£m
Trading & Banking Solutions
Trading
Banking
Enterprise Data Solutions
Real-Time Data
PRS
Investment Solutions
Benchmark Rates, Indices & Analytics
Index - Asset-Based
Data & Workflow
Wealth Solutions
Advisor & Investor Services
Operations Management (BETA)
Customer & Third-Party Risk Solutions
Data & Analytics
WOLSEG
Q1
372
297
75
279
177
102
273
121
58
94
122
69
53
85
1,131
Q2
373
297
76
283
183
100
286
126
64
96
116
70
46
90
1,148
Note:
Revenues quoted on this slide are indicative only
Q3
373
296
77
284
182
102
294
136
62
96
115
69
46
92
1,158
Q4
375
297
78
297
190
107
302
134
69
99
121
73
48
92
1,187
2021
1,493
1,187
306
1,143
732
411
1,155
517
253
385
474
281
193
359
4,624
£m
Equities
FX
Fixed Income, Derivatives & Other
Capital Markets
OTC Derivatives
Securities & Reporting
Non-Cash Collateral
Net Treasury Income
Post Trade
Other
Total Income (excl. recoveries)
Recoveries
Total Income (incl. recoveries)
Q1
61
57
200
318
87
63
22
55
227
5
1,681
88
1,769
Q2
59
53
187
299
82
59
24
53
218
10
1,675
90
1,765
Q3
60
56
193
309
86
60
24
47
217
9
1,693
90
1,783
Q4
61
57
205
323
103
62
25
52
242
10
1,762
86
1,848
2021
241
223
785
1,249
358
244
95
207
904
34
6,811
354
7,165
51View entire presentation