Despegar Results Presentation Deck
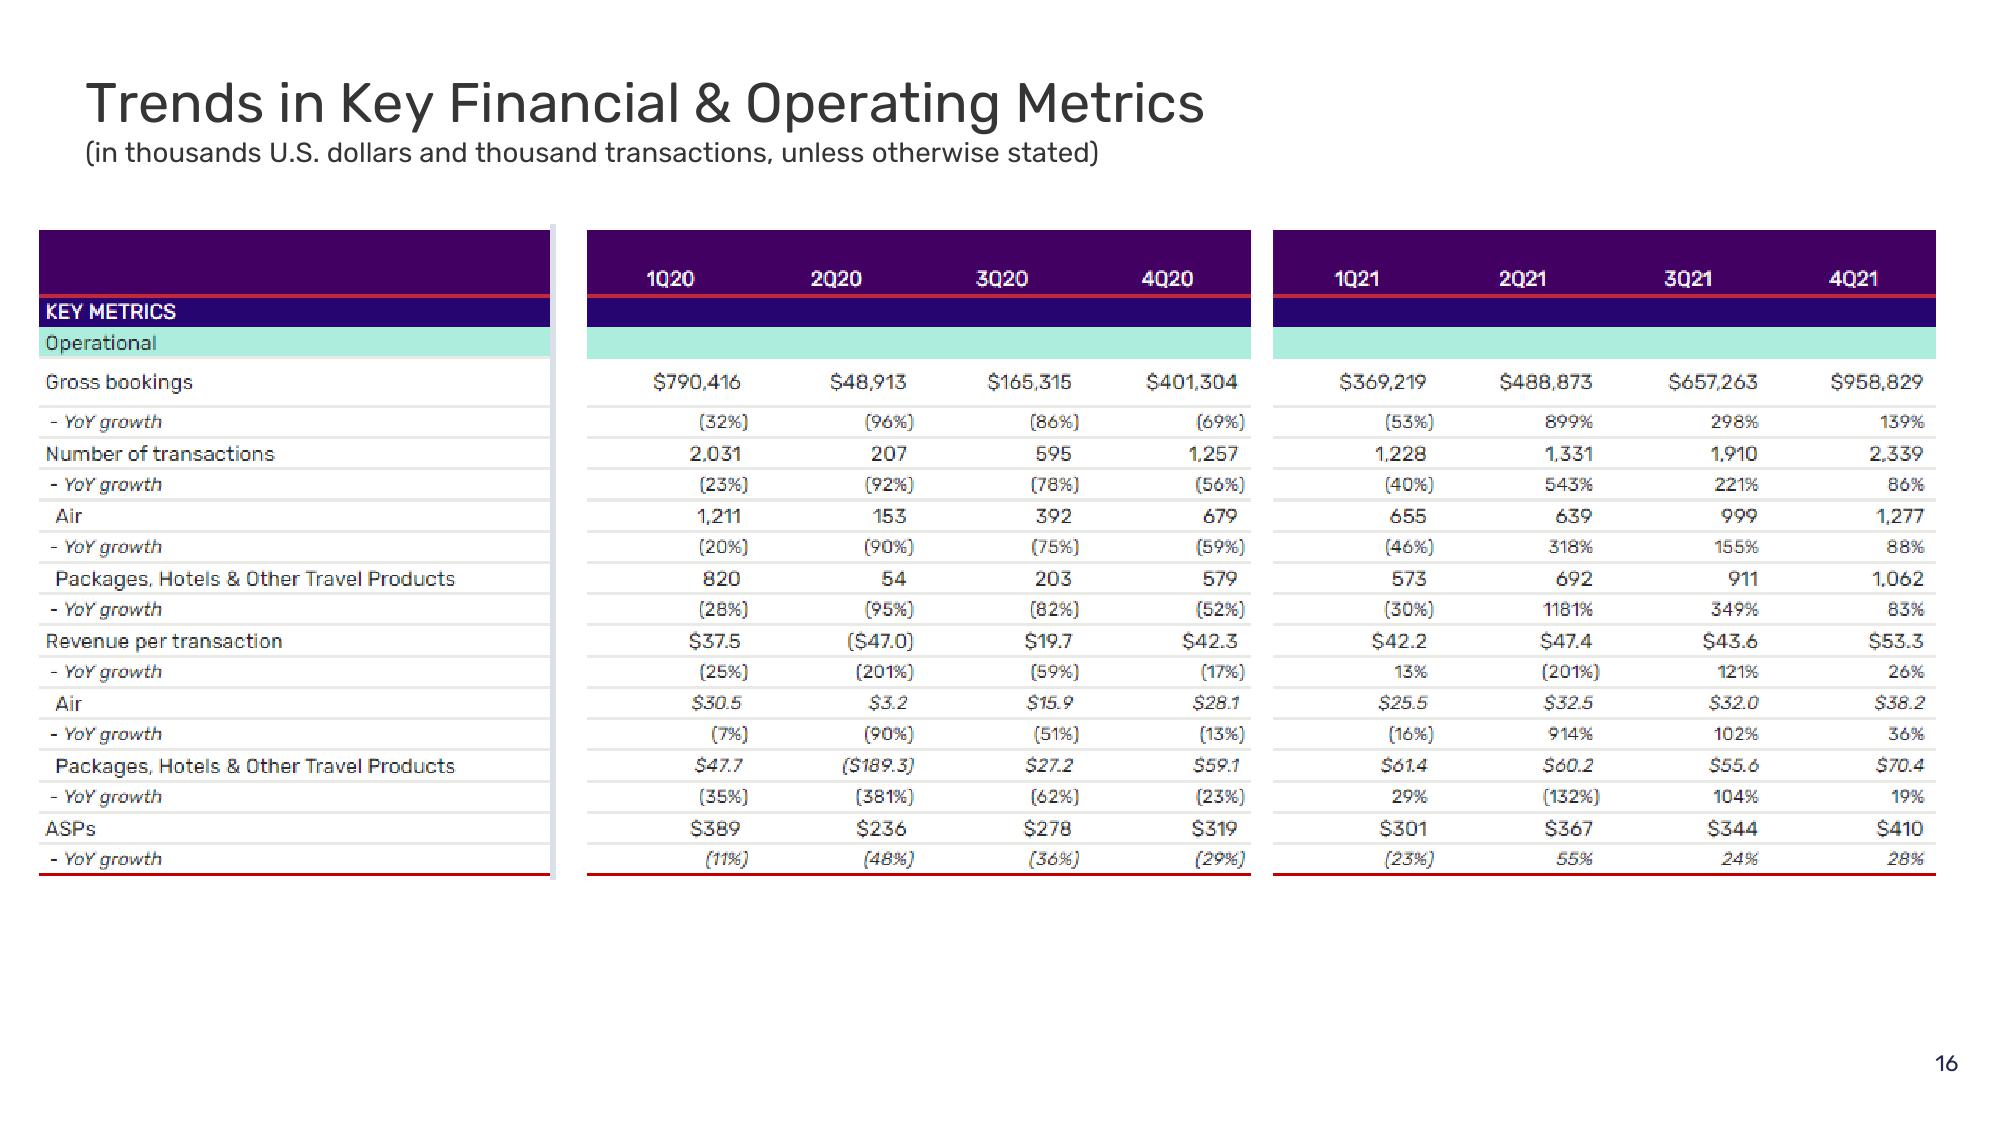
Trends in Key Financial & Operating Metrics
(in thousands U.S. dollars and thousand transactions, unless otherwise stated)
KEY METRICS
Operational
Gross bookings
- YoY growth
Number of transactions
- YoY growth
Air
- YoY growth
Packages, Hotels & Other Travel Products
- YoY growth
Revenue per transaction
- YoY growth
Air
- YoY growth
Packages, Hotels & Other Travel Products
- YoY growth
ASPS
- YoY growth
1020
$790,416
(32%)
2,031
(23%)
1,211
(20%)
820
(28%)
$37.5
(25%)
$30.5
(7%)
$47.7
(35%)
$389
(11%)
2020
$48,913
(96%)
207
(92%)
153
(90%)
54
(95%)
($47.0)
(201%)
$3.2
(90%)
($189.3)
(381%)
$236
(48%)
3020
$165,315
(86%)
595
(78%)
392
(75%)
203
(82%)
$19.7
(59%)
$15.9
(51%)
$27.2
(62%)
$278
(36%)
4020
$401,304
(69%)
1,257
(56%)
679
(59%)
579
(52%)
$42.3
(17%)
$28.1
(13%)
$59.1
(23%)
$319
(29%)
1021
$369,219
(53%)
1,228
(40%)
655
(46%)
573
(30%)
$42.2
13%
$25.5
(16%)
$61.4
29%
$301
(23%)
2021
$488,873
899%
1.331
543%
639
318%
692
1181%
$47.4
(201%)
$32.5
914%
$60.2
(132%)
$367
55%
3021
$657,263
298%
1,910
221%
999
155%
911
349%
$43.6
121%
$32.0
102%
$55.6
104%
$344
24%
4021
$958,829
139%
2,339
86%
1,277
88%
1,062
83%
$53.3
26%
$38.2
36%
$70.4
19%
$410
28%
16View entire presentation