T-Mobile Investor Day Presentation Deck
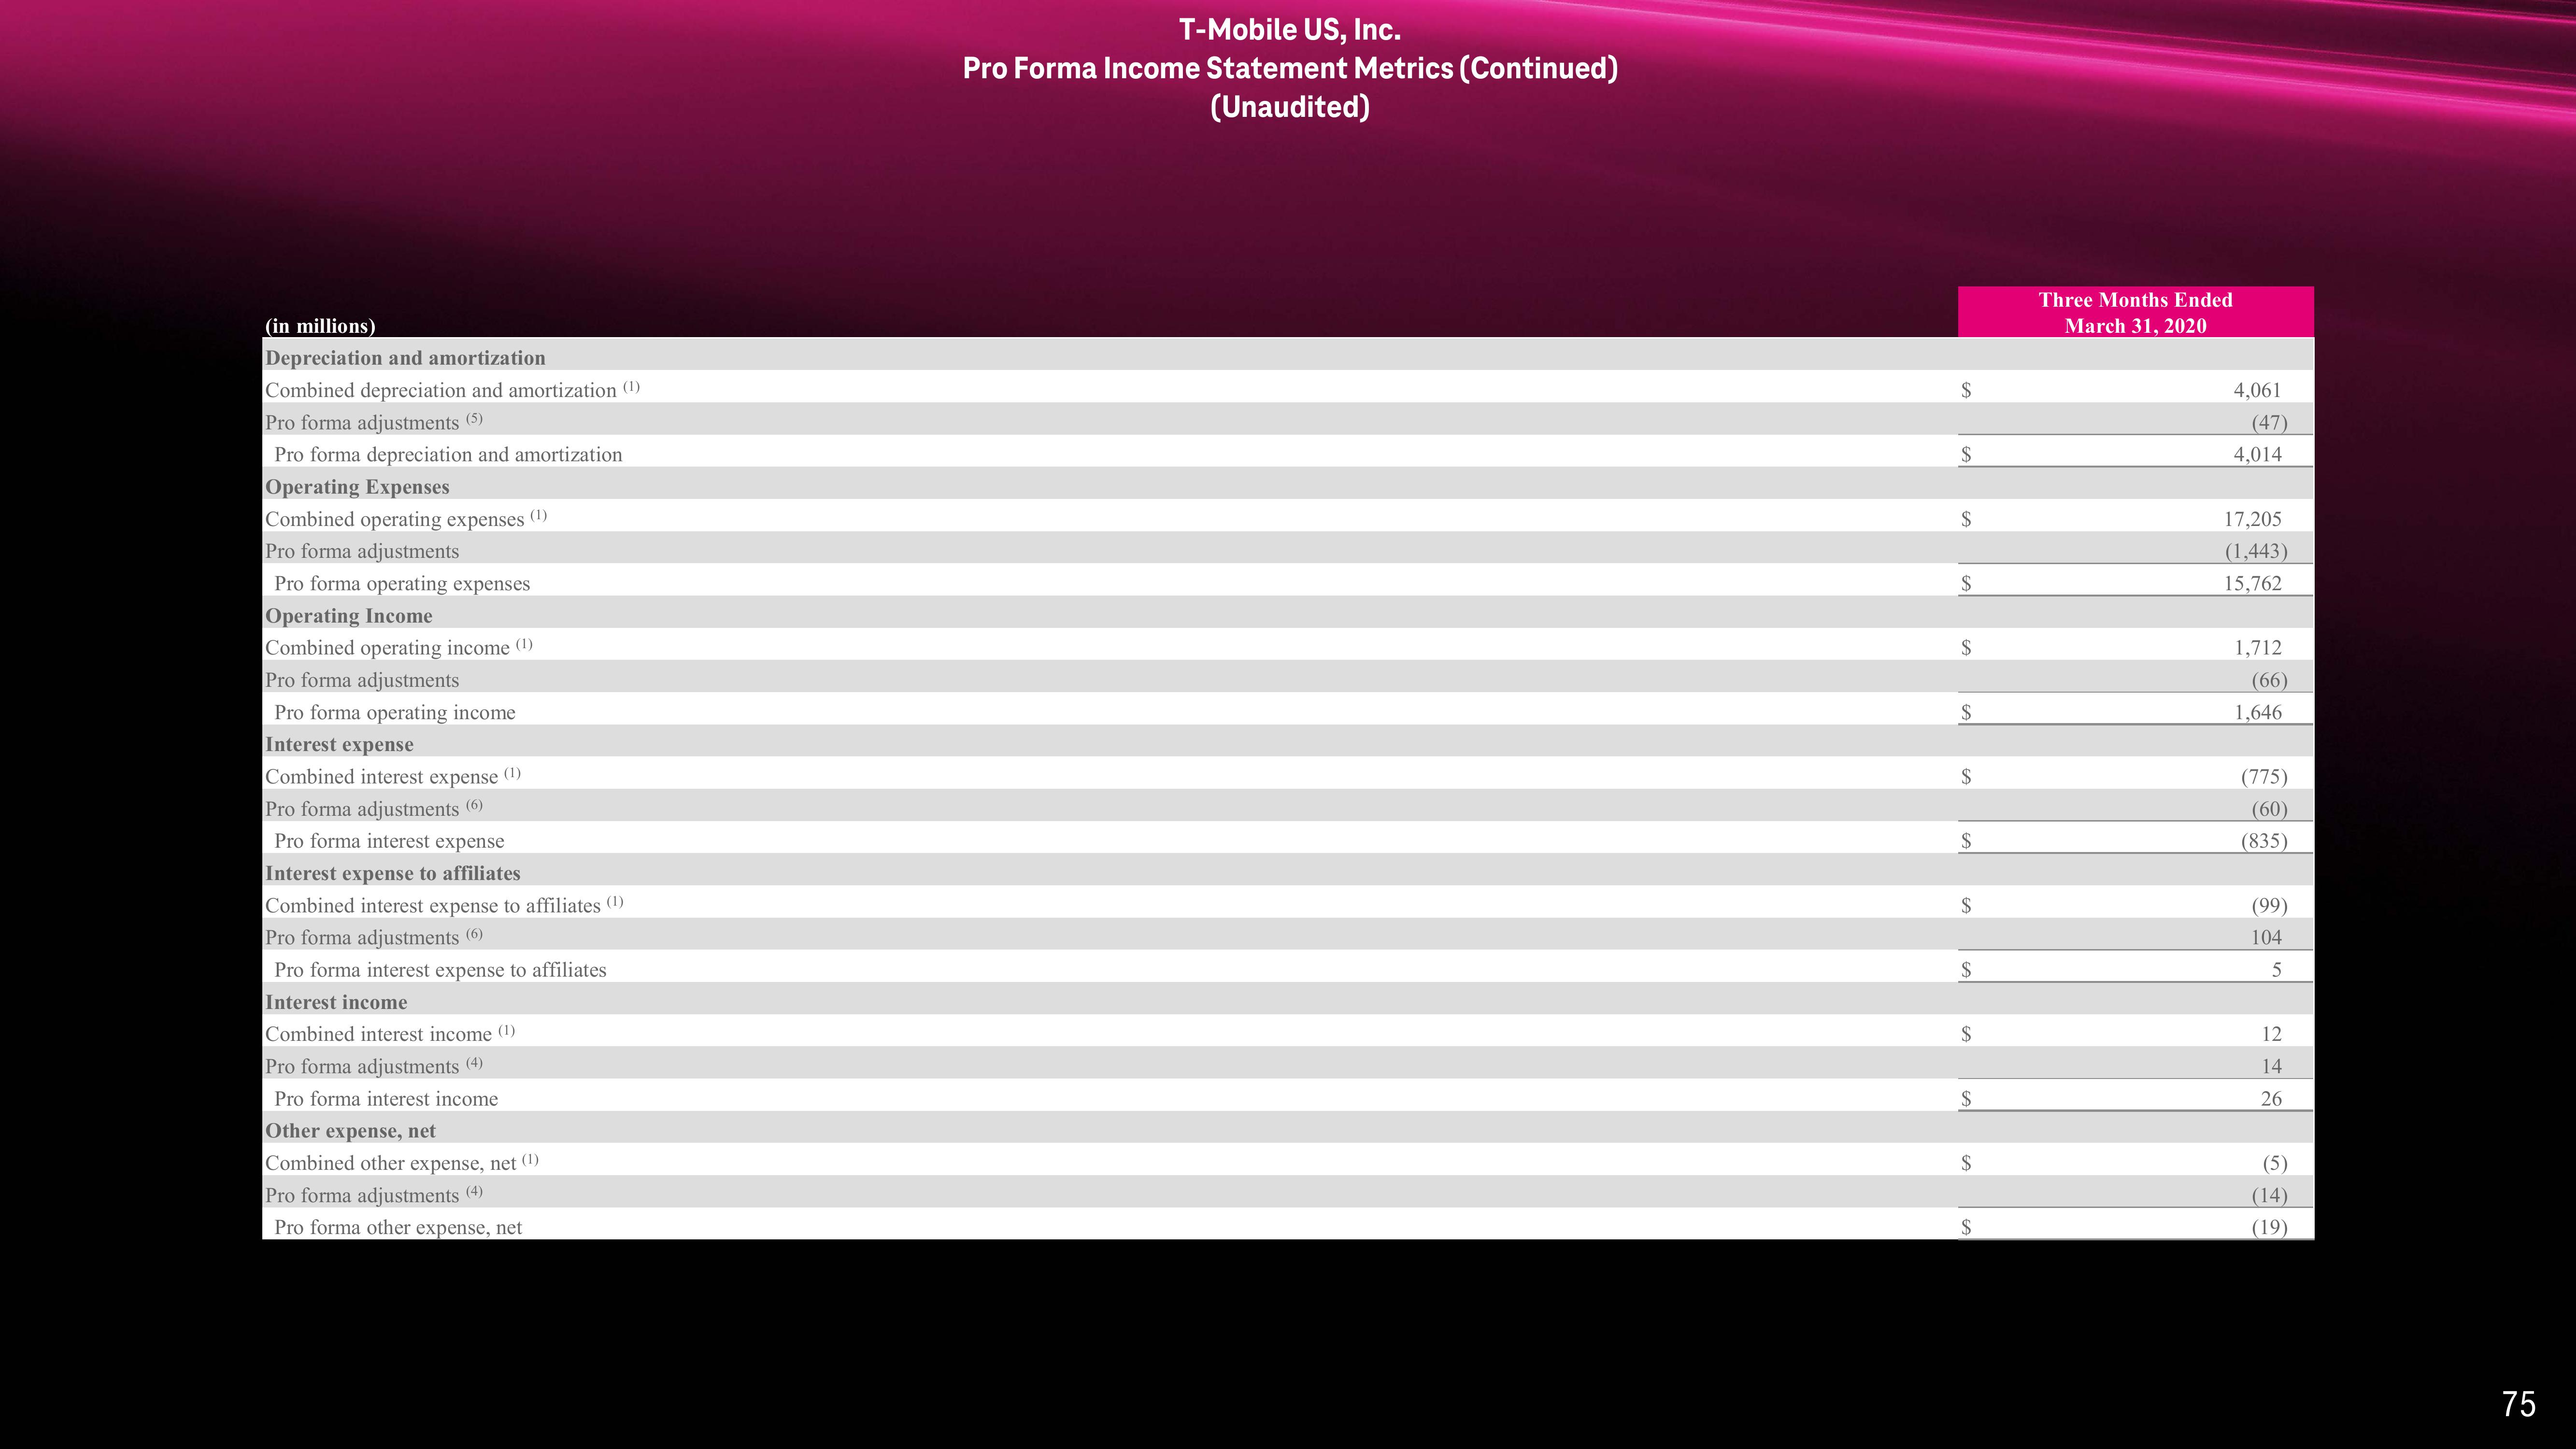
(in millions)
Depreciation and amortization
Combined depreciation and amortization (1)
Pro forma adjustments (5)
Pro forma depreciation and amortization
Operating Expenses
Combined operating expenses (¹)
Pro forma adjustments
Pro forma operating expenses
Operating Income
Combined operating income (1)
Pro forma adjustments
Pro forma operating income
Interest expense
Combined interest expense (¹)
Pro forma adjustments (6)
Pro forma interest expense
Interest expense to affiliates
Combined interest expense to affiliates (1)
Pro forma adjustments (6)
Pro forma interest expense to affiliates
Interest income
Combined interest income (1)
Pro forma adjustments (4)
Pro forma interest income
Other expense, net
Combined other expense, net (1)
Pro forma adjustments (4)
Pro forma other expense, net
T-Mobile US, Inc.
Pro Forma Income Statement Metrics (Continued)
(Unaudited)
S
S
$
S
$
$
$
S
$
S
$
Three Months Ended
March 31, 2020
4,061
(47)
4,014
17,205
(1,443)
15,762
1,712
(66)
1,646
(775)
(60)
(835)
(99)
104
5
12
14
26
(5)
(14)
(19)
75View entire presentation