Barclays Credit Presentation Deck
STRATEGY, TARGETS
& GUIDANCE
●
13,886
299
4,302
PERFORMANCE
FY21 total costs +4% YoY (£m)
14,439
170
2,120
6,693
ASSET QUALITY
Costs: FY21 increase driven by higher structural cost actions and
performance costs, with flat base costs
472
FY20
Head Office ■CIB ■CC&P ■BUK
¹ Costs excluding structural cost actions and performance costs |
19 | Barclays Q4 2021 Results | 23 February 2022
4,394
CAPITAL
& LEVERAGE
2,366
6,835
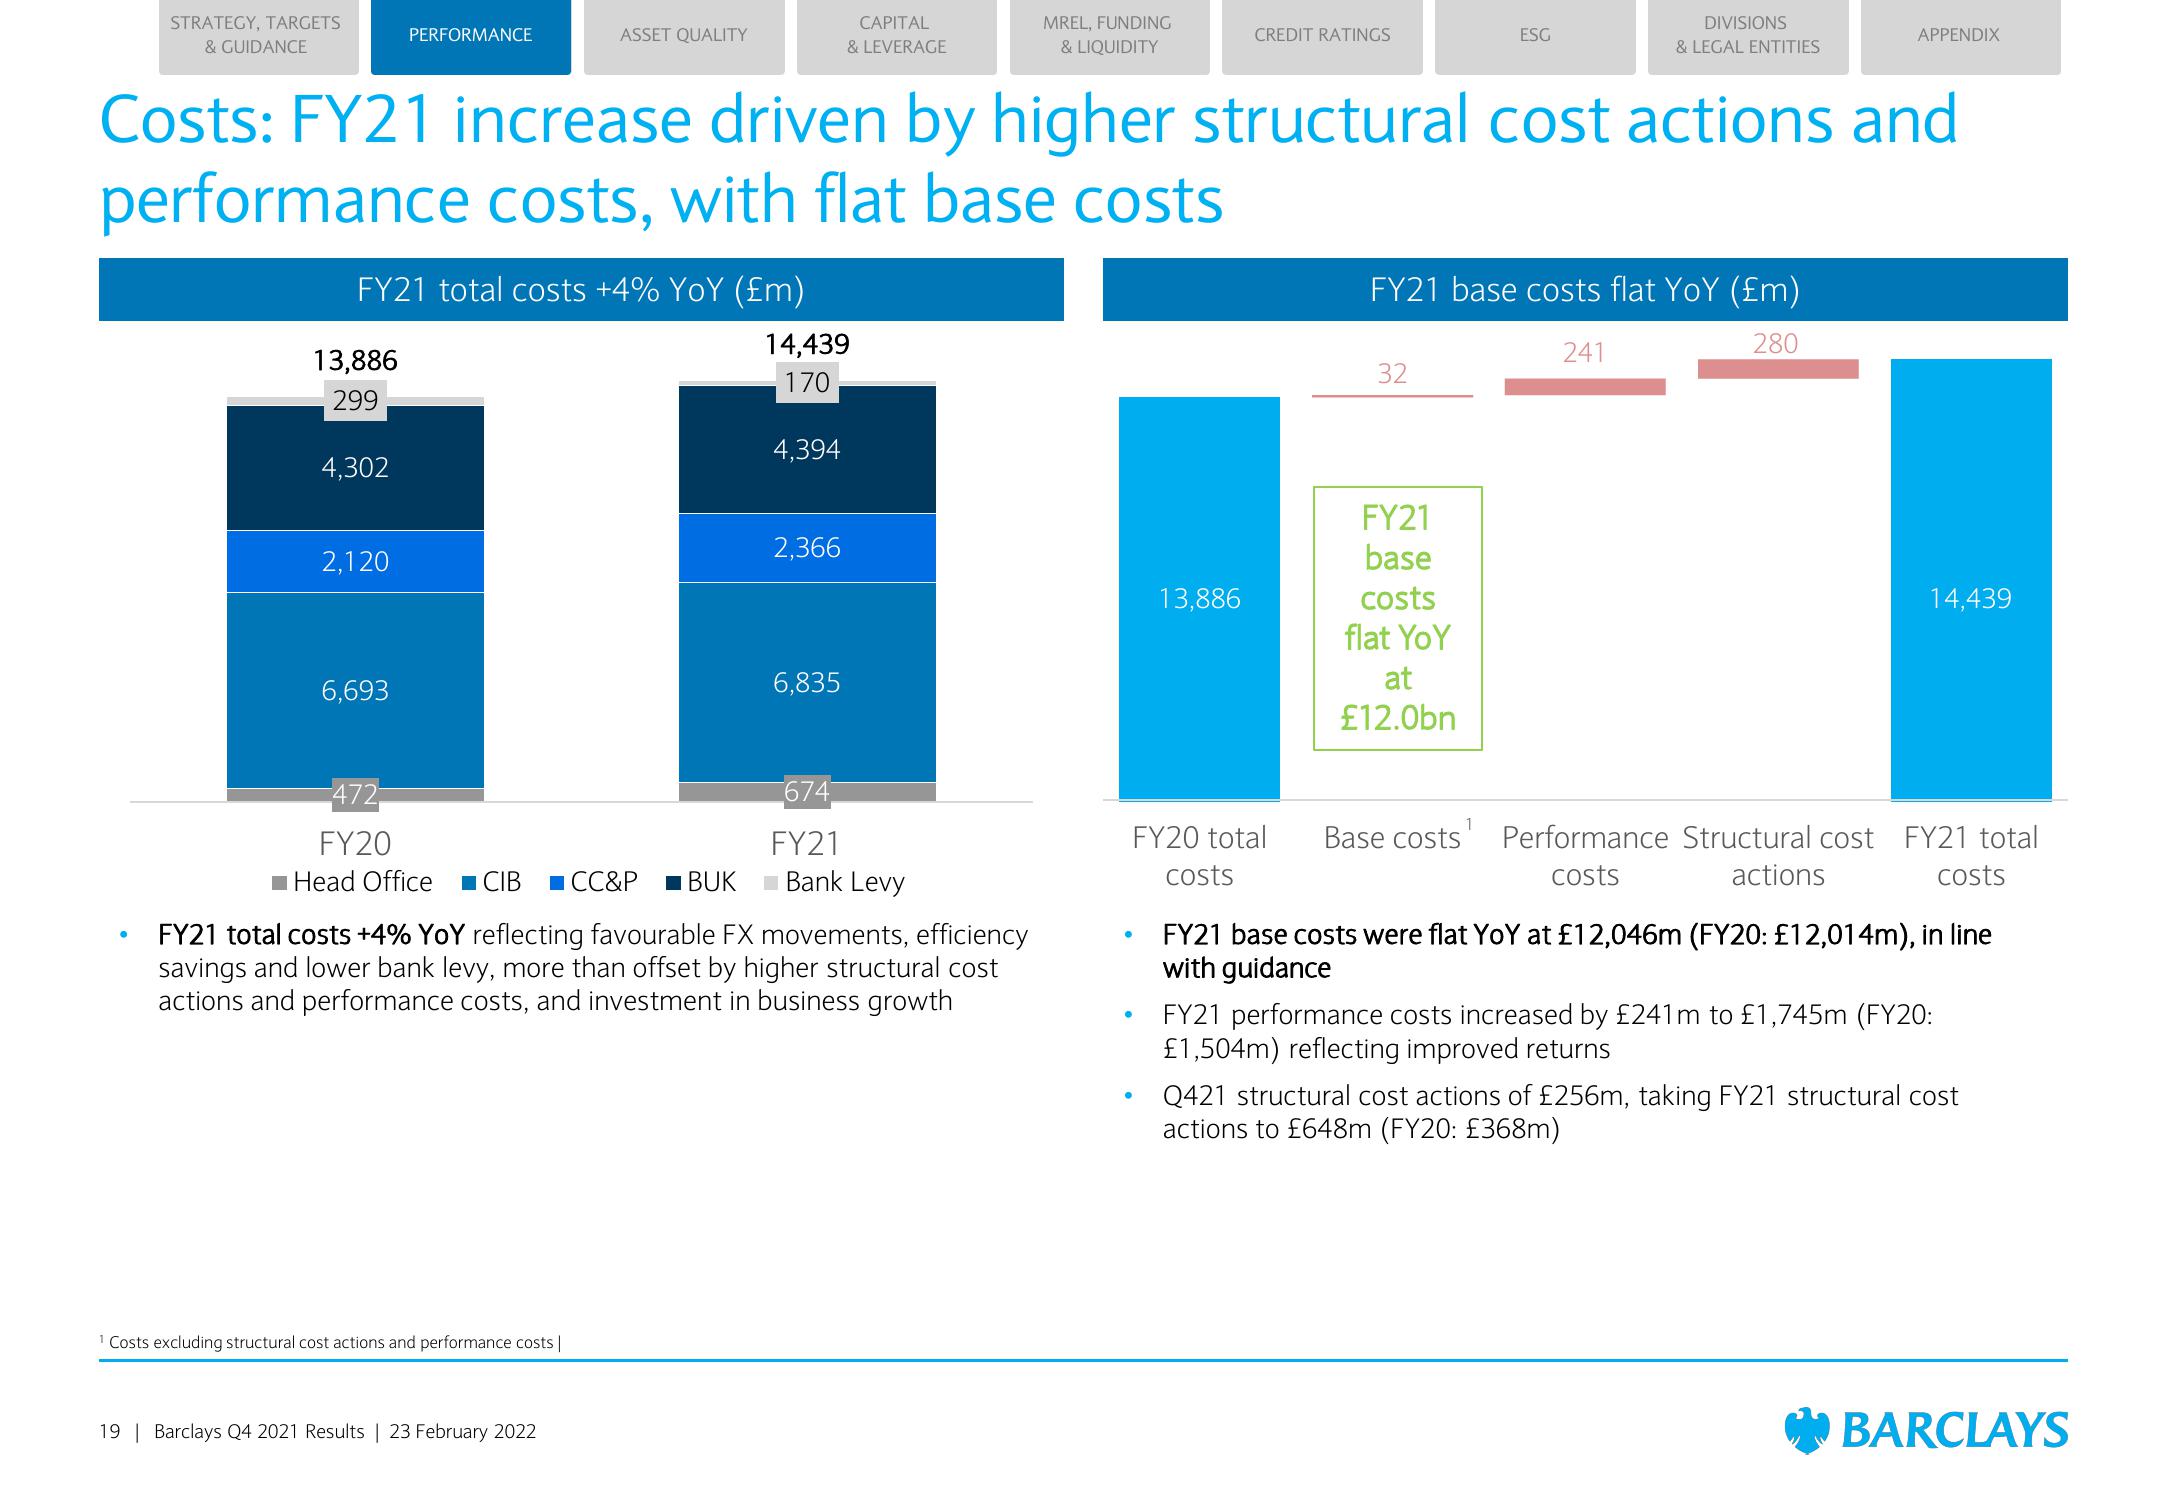
FY21 total costs +4% YoY reflecting favourable FX movements, efficiency
savings and lower bank levy, more than offset by higher structural cost
actions and performance costs, and investment in business growth
674
FY21
Bank Levy
MREL, FUNDING
& LIQUIDITY
CREDIT RATINGS
13,886
ESG
32
DIVISIONS
& LEGAL ENTITIES
FY21 base costs flat YoY (Em)
280
241
FY21
base
costs
flat YoY
at
£12.0bn
APPENDIX
14,439
FY20 total Base costs Performance Structural cost FY21 total
costs
costs
actions
costs
FY21 base costs were flat YoY at £12,046m (FY20: £12,014m), in line
with guidance
FY21 performance costs increased by £241m to £1,745m (FY20:
£1,504m) reflecting improved returns
Q421 structural cost actions of £256m, taking FY21 structural cost
actions to £648m (FY20: £368m)
BARCLAYSView entire presentation