Bed Bath & Beyond Results Presentation Deck
Fiscal 2018 Modeling Assumptions
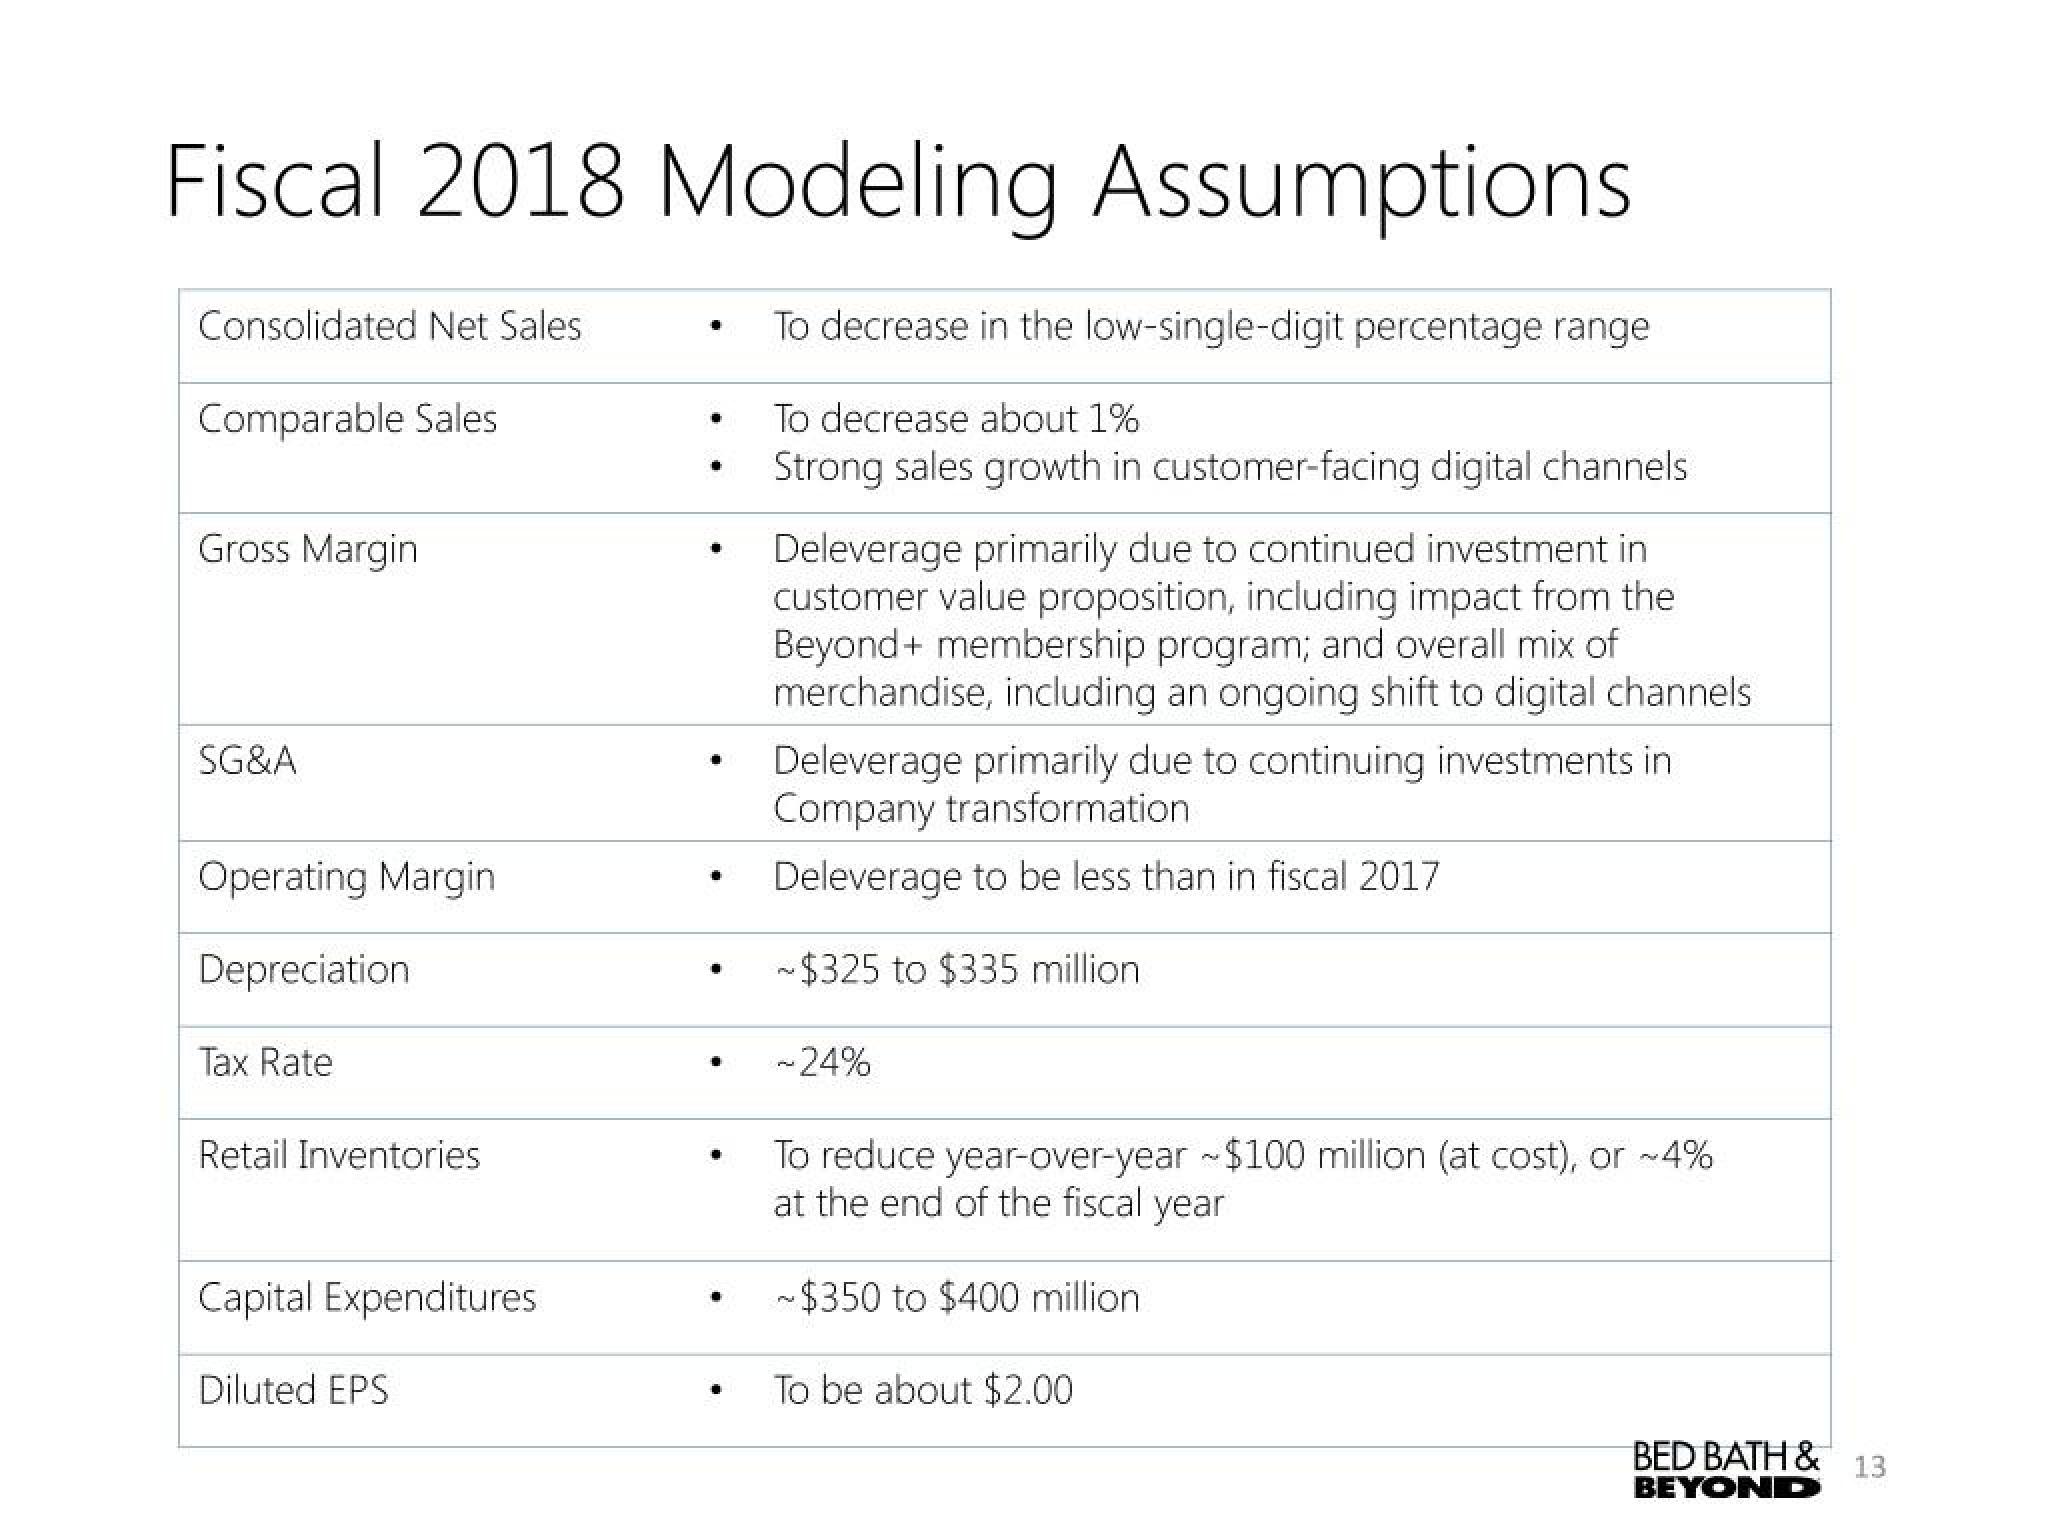
Consolidated Net Sales
Comparable Sales
Gross Margin
SG&A
Operating Margin
Depreciation
Tax Rate
Retail Inventories
Capital Expenditures
Diluted EPS
.
To decrease in the low-single-digit percentage range
To decrease about 1%
Strong sales growth in customer-facing digital channels
Deleverage primarily due to continued investment in
customer value proposition, including impact from the
Beyond+ membership program; and overall mix of
merchandise, including an ongoing shift to digital channels
Deleverage primarily due to continuing investments in
Company transformation
Deleverage to be less than in fiscal 2017
~$325 to $335 million.
~24%
To reduce year-over-year-$100 million (at cost), or ~4%
at the end of the fiscal year
~$350 to $400 million.
To be about $2.00
BED BATH &
BEYOND
13View entire presentation