Silicon Valley Bank Results Presentation Deck
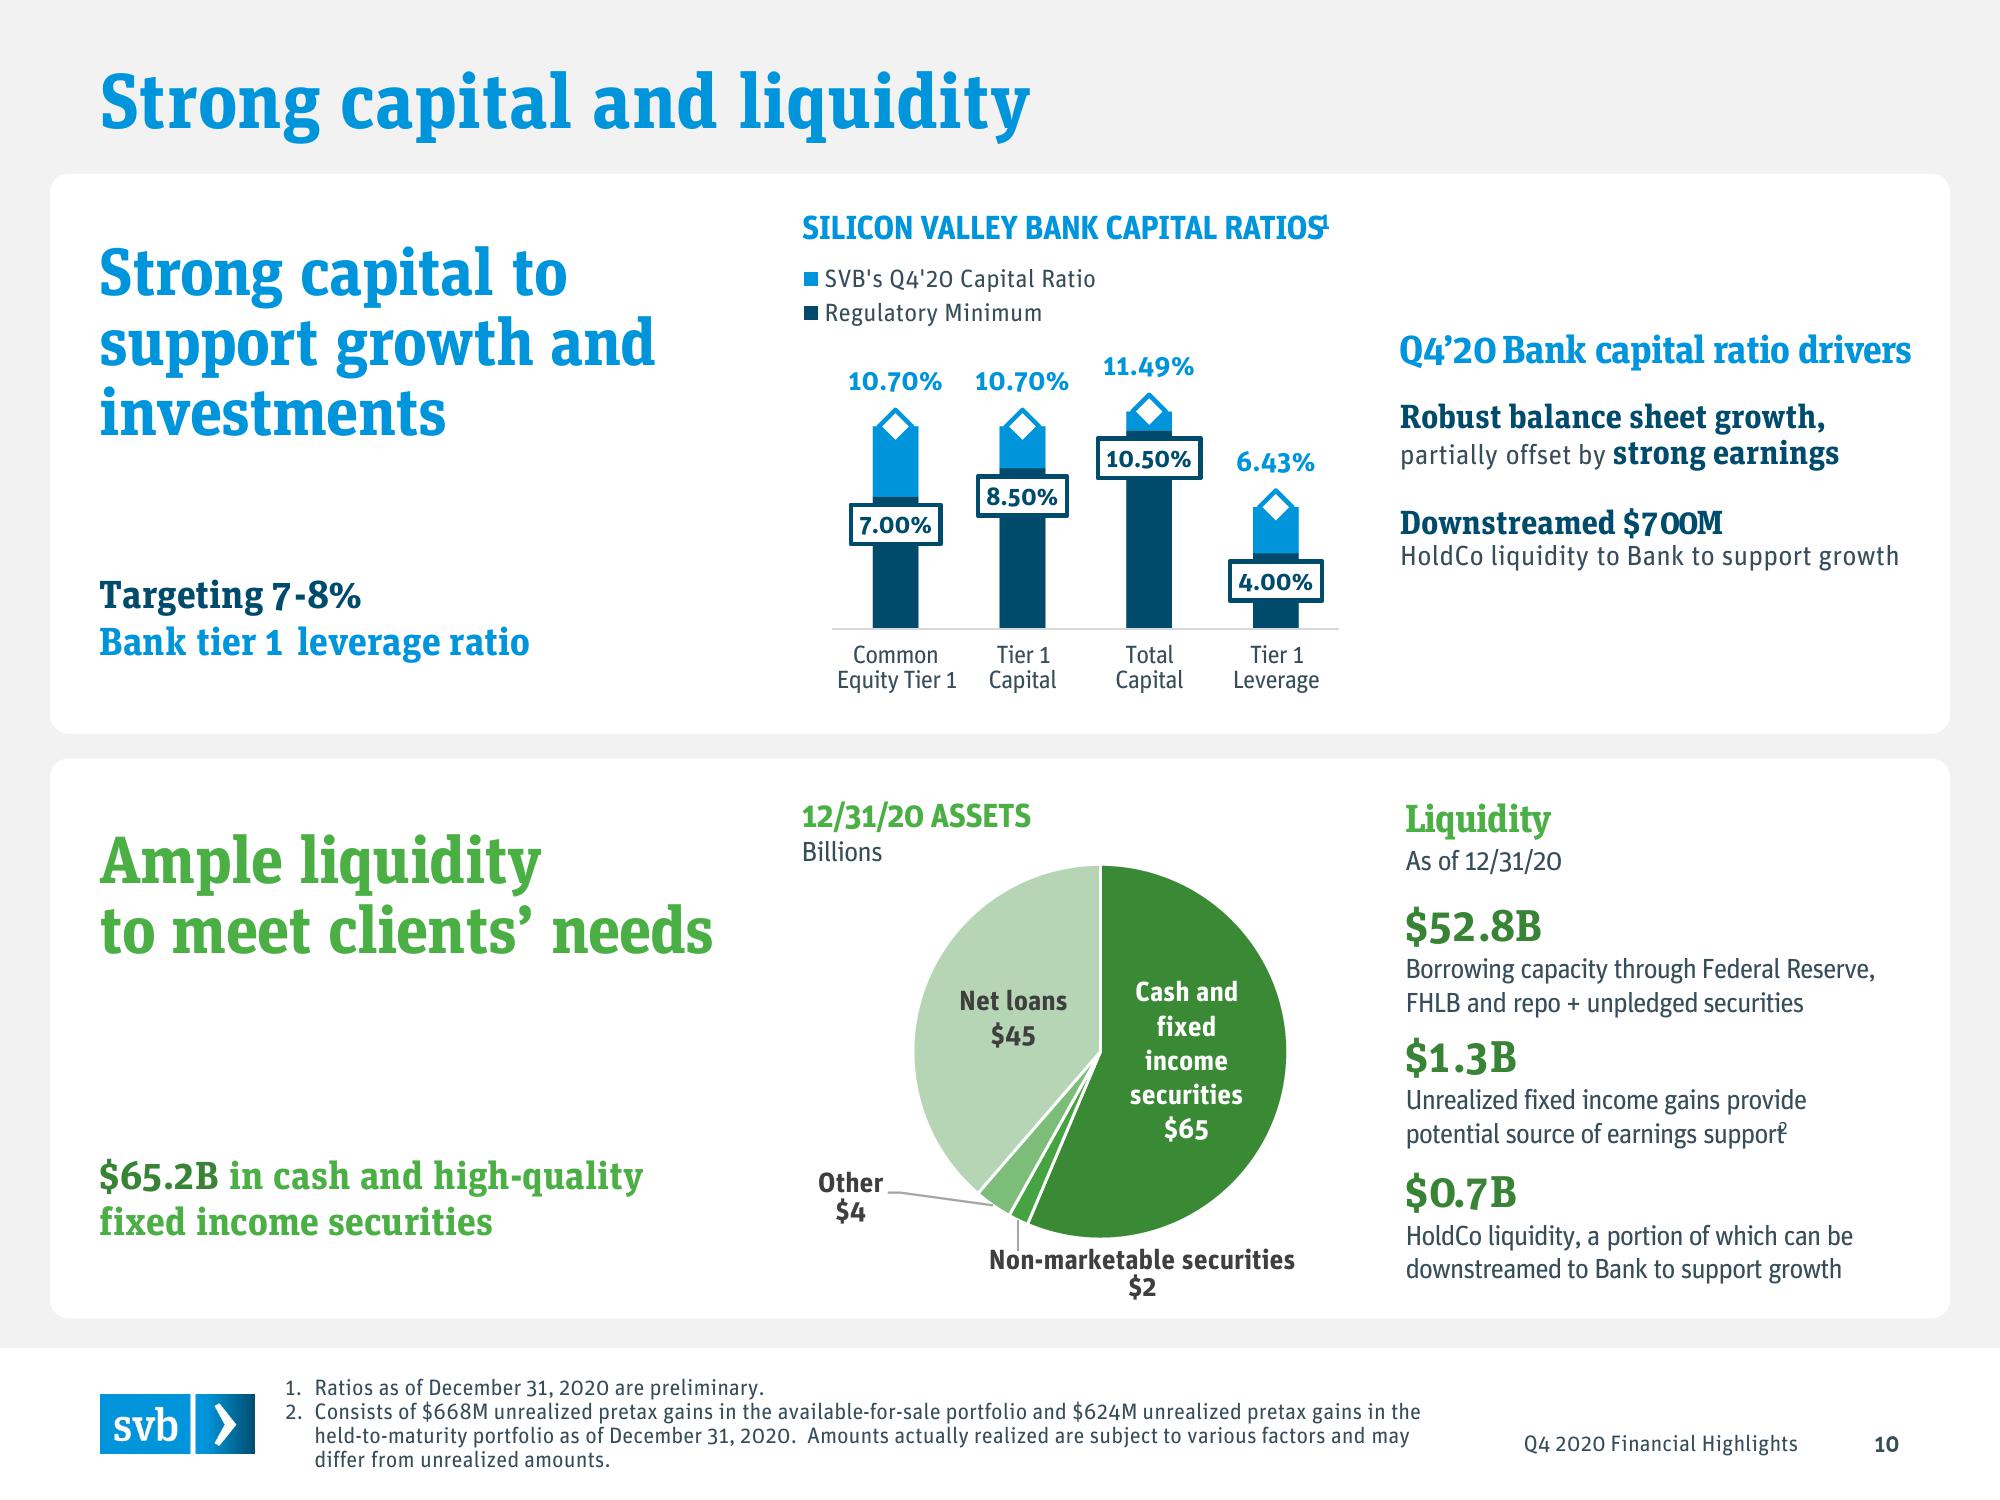
Strong capital and liquidity
Strong capital to
support growth and
investments
Targeting 7-8%
Bank tier 1 leverage ratio
Ample liquidity
to meet clients' needs
$65.2B in cash and high-quality
fixed income securities
svb >
SILICON VALLEY BANK CAPITAL RATIOS¹
SVB's Q4'20 Capital Ratio
I Regulatory Minimum
10.70% 10.70%
7.00%
Common
Equity Tier 1
Other
$4
Tier 1
Capital
12/31/20 ASSETS
Billions
8.50%
TT
11.49%
Net loans
$45
10.50% 6.43%
Total
Capital
4.00%
Tier 1
Leverage
Cash and
fixed
income
securities
$65
$2
Non-marketable securities
Q4'20 Bank capital ratio drivers
Robust balance sheet growth,
partially offset by strong earnings
Downstreamed $700M
HoldCo liquidity to Bank to support growth
Liquidity
As of 12/31/20
$52.8B
Borrowing capacity through Federal Reserve,
FHLB and repo + unpledged securities
$1.3B
Unrealized fixed income gains provide
potential source of earnings support
$0.7B
HoldCo liquidity, a portion of which can be
downstreamed to Bank to support growth
1. Ratios as of December 31, 2020 are preliminary.
2. Consists of $668M unrealized pretax gains in the available-for-sale portfolio and $624M unrealized pretax gains in the
held-to-maturity portfolio as of December 31, 2020. Amounts actually realized are subject to various factors and may
differ from unrealized amounts.
Q4 2020 Financial Highlights
10View entire presentation