Tudor, Pickering, Holt & Co Investment Banking
AR Historical and Projected Taxes
Assumptions
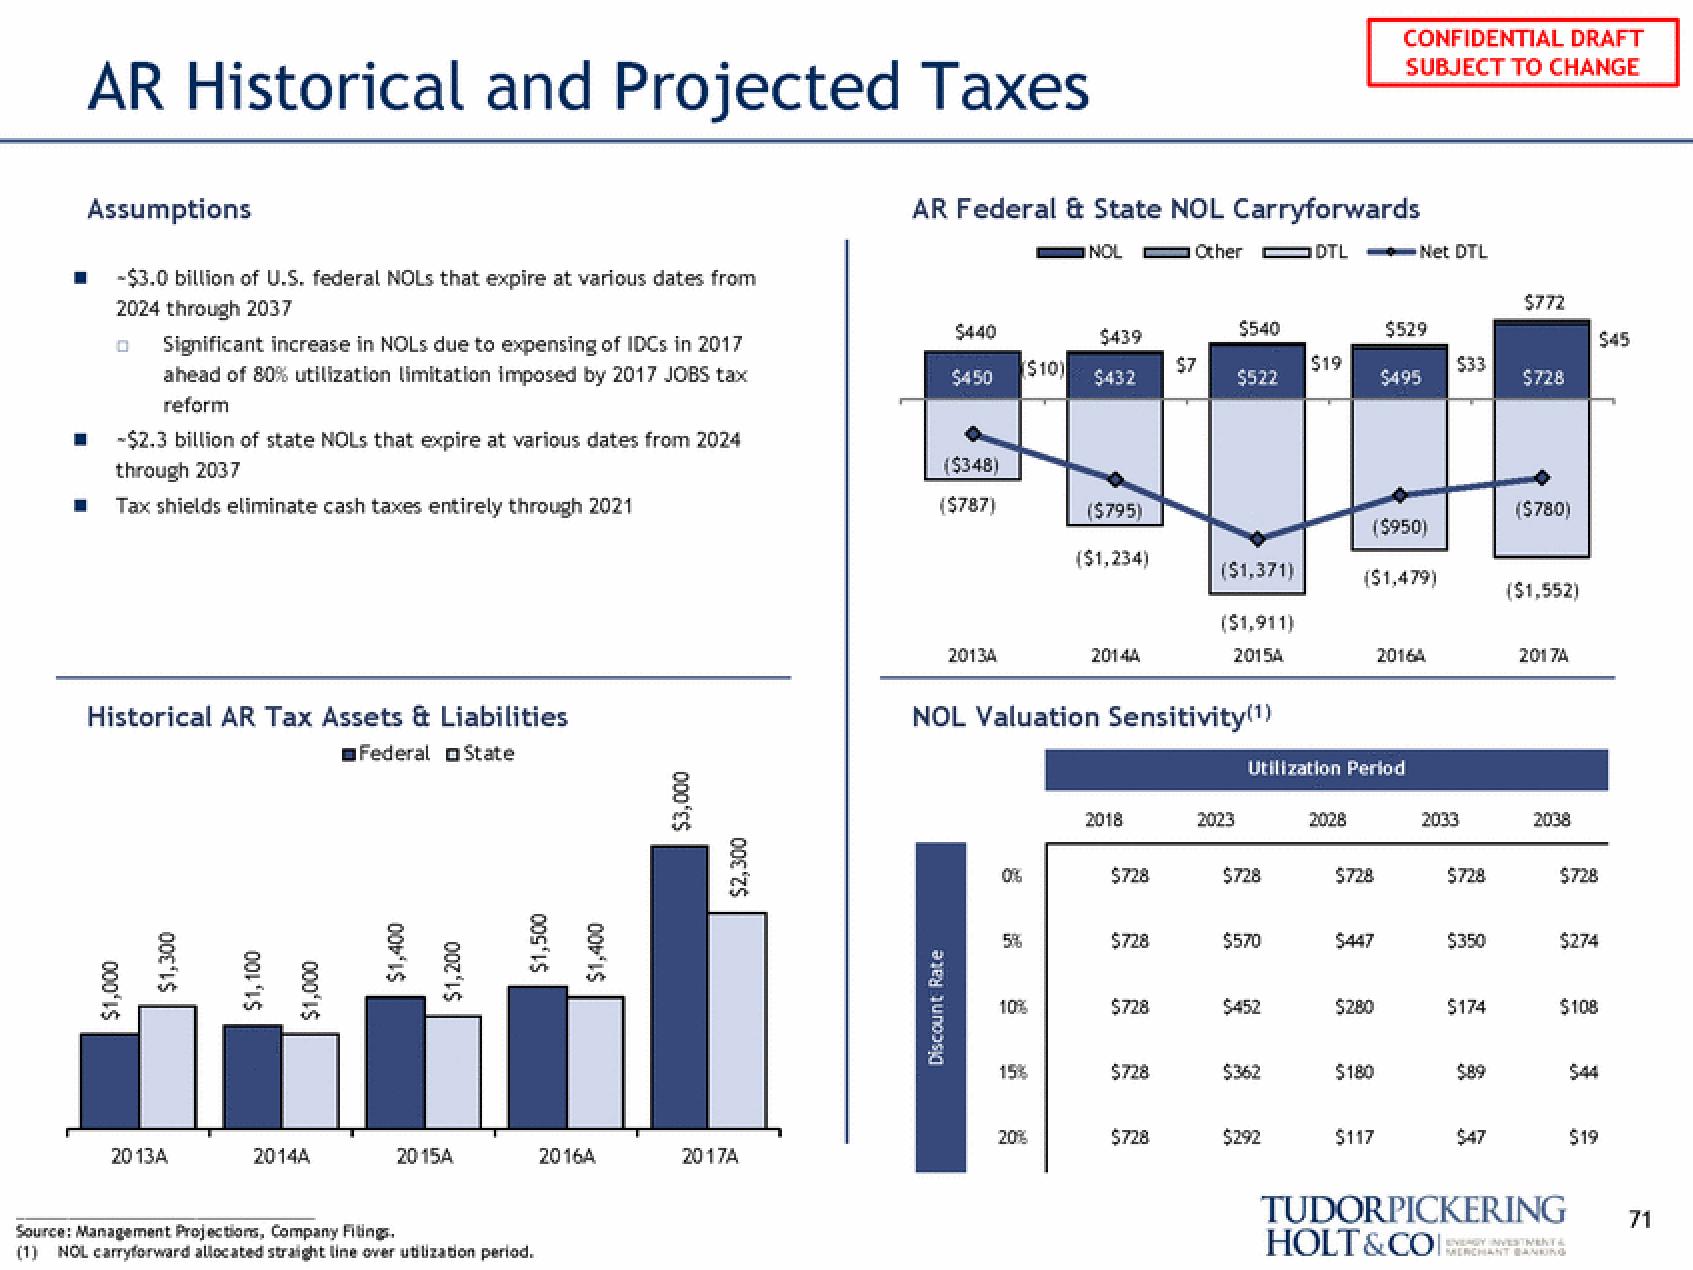
-$3.0 billion of U.S. federal NOLs that expire at various dates from
2024 through 2037
0 Significant increase in NOLS due to expensing of IDCs in 2017
ahead of 80% utilization limitation imposed by 2017 JOBS tax
reform
-$2.3 billion of state NOLS that expire at various dates from 2024
through 2037
Tax shields eliminate cash taxes entirely through 2021
Historical AR Tax Assets & Liabilities
Federal State
$1,000
$1,300
2013A
$1,100
$1,000
2014A
$1,400
$1,200
2015A
$1,500
$1,400
Source: Management Projections, Company Filings.
(1) NOL carryforward allocated straight line over utilization period.
2016A
$3,000
$2,300
2017A
AR Federal & State NOL Carryforwards
NOL
Other DTL
$440
$450
($348)
($787)
Discount Rate
2013A
($10)
06
5%
10%
15%
$439
$432
20%
($795)
($1,234)
NOL Valuation Sensitivity(¹)
2014A
2018
$728
$728
$728
$728
$7
$728
$540
$522
($1,371)
($1,911)
2015A
2023
$728
$570
$452
$362
$19
$292
Utilization Period
2028
$728
$447
CONFIDENTIAL DRAFT
SUBJECT TO CHANGE
($950)
($1,479)
$280
$180
$117
Net DTL
$529
$495
2016A
$33
2033
$728
$350
$174
$89
$47
$772
$728
($780)
($1,552)
2017A
2038
$728
$274
$108
TUDORPICKERING
HOLT&CO
EVERGY INVESTMENTS
MERCHANT BANKING
$45
$44
$19
71View entire presentation