Q2 2018 Fixed Income Investor Conference Call
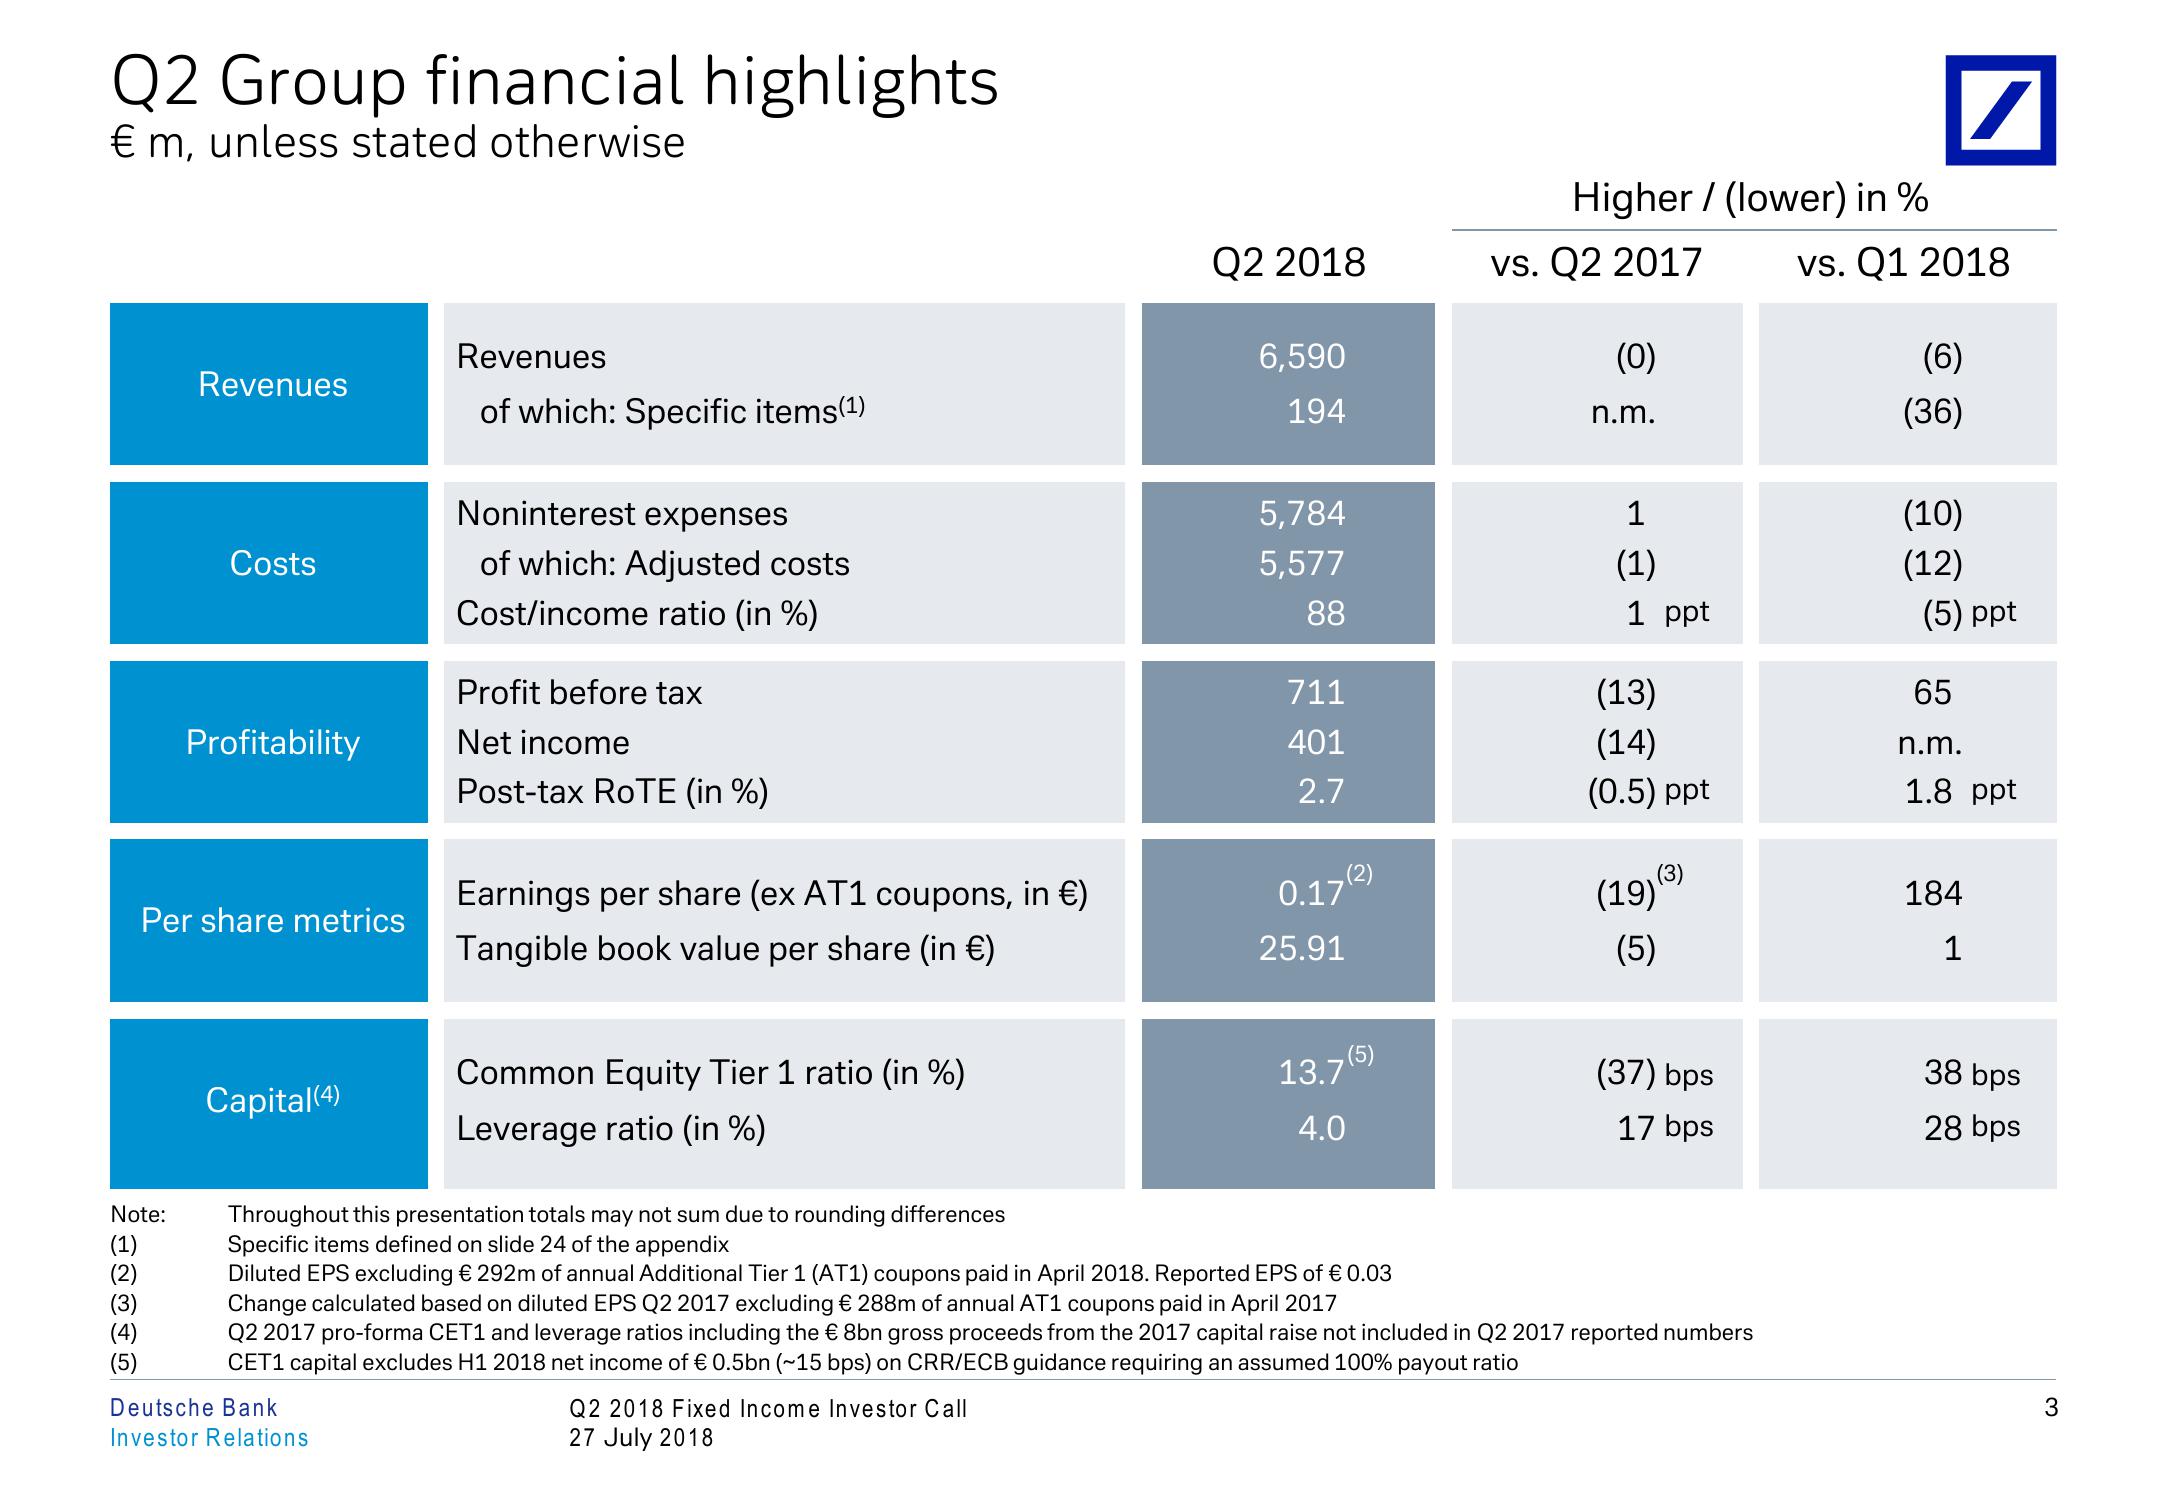
Q2 Group financial highlights
€ m, unless stated otherwise
Higher (lower) in %
Revenues
Revenues
of which: Specific items(1)
Q2 2018
vs. Q2 2017
6,590
(0)
194
n.m.
vs. Q1 2018
(6)
(36)
Noninterest expenses
5,784
1
(10)
Costs
of which: Adjusted costs
5,577
(1)
(12)
Cost/income ratio (in %)
88
1 ppt
(5) ppt
Profit before tax
711
(13)
65
Profitability
Net income
401
(14)
n.m.
Post-tax RoTE (in %)
2.7
(0.5) ppt
1.8 ppt
Earnings per share (ex AT1 coupons, in €)
0.17(2)
Per share metrics
Tangible book value per share (in €)
25.91
(19)
(5)
184
1
Capital(4)
Common Equity Tier 1 ratio (in %)
Leverage ratio (in %)
13.7(5)
(37) bps
38 bps
4.0
17 bps
28 bps
Note:
Throughout this presentation totals may not sum due to rounding differences
(1)
Specific items defined on slide 24 of the appendix
(2)
(3)
Diluted EPS excluding € 292m of annual Additional Tier 1 (AT1) coupons paid in April 2018. Reported EPS of € 0.03
Change calculated based on diluted EPS Q2 2017 excluding € 288m of annual AT1 coupons paid in April 2017
(4)
(5)
Q2 2017 pro-forma CET1 and leverage ratios including the € 8bn gross proceeds from the 2017 capital raise not included in Q2 2017 reported numbers
CET1 capital excludes H1 2018 net income of € 0.5bn (~15 bps) on CRR/ECB guidance requiring an assumed 100% payout ratio
Deutsche Bank
Investor Relations
Q2 2018 Fixed Income Investor Call
27 July 2018
3View entire presentation