Morgan Stanley Investment Banking Pitch Book
Project Roosevelt
Assumptions
- Preferred equity continues
PIK with no cash component
- Cost of Equity: 11.8%-15.0%
- Exit EBITDA Multiple for
Total EBITDA of 11.5x-
13.5x
- Reflects blended exit
multiple of long term sector
averages +/- 1.0x
- Assumes going concern
valuation: no transaction
costs
Unquantified execution risks
- Forecast period: assumes
20% preferred equity can be
refinanced at between 10%
(low WACC) and 15% (high
WACC)
- Cost of equity floor set by
preferred coupon
- Terminal period: going
concern achieves ability to
attract preferred equity at a
10% cost of capital
- Cost of equity then based
on CAPM for Mid and
CAPM+100bps for High
Morgan Stanley
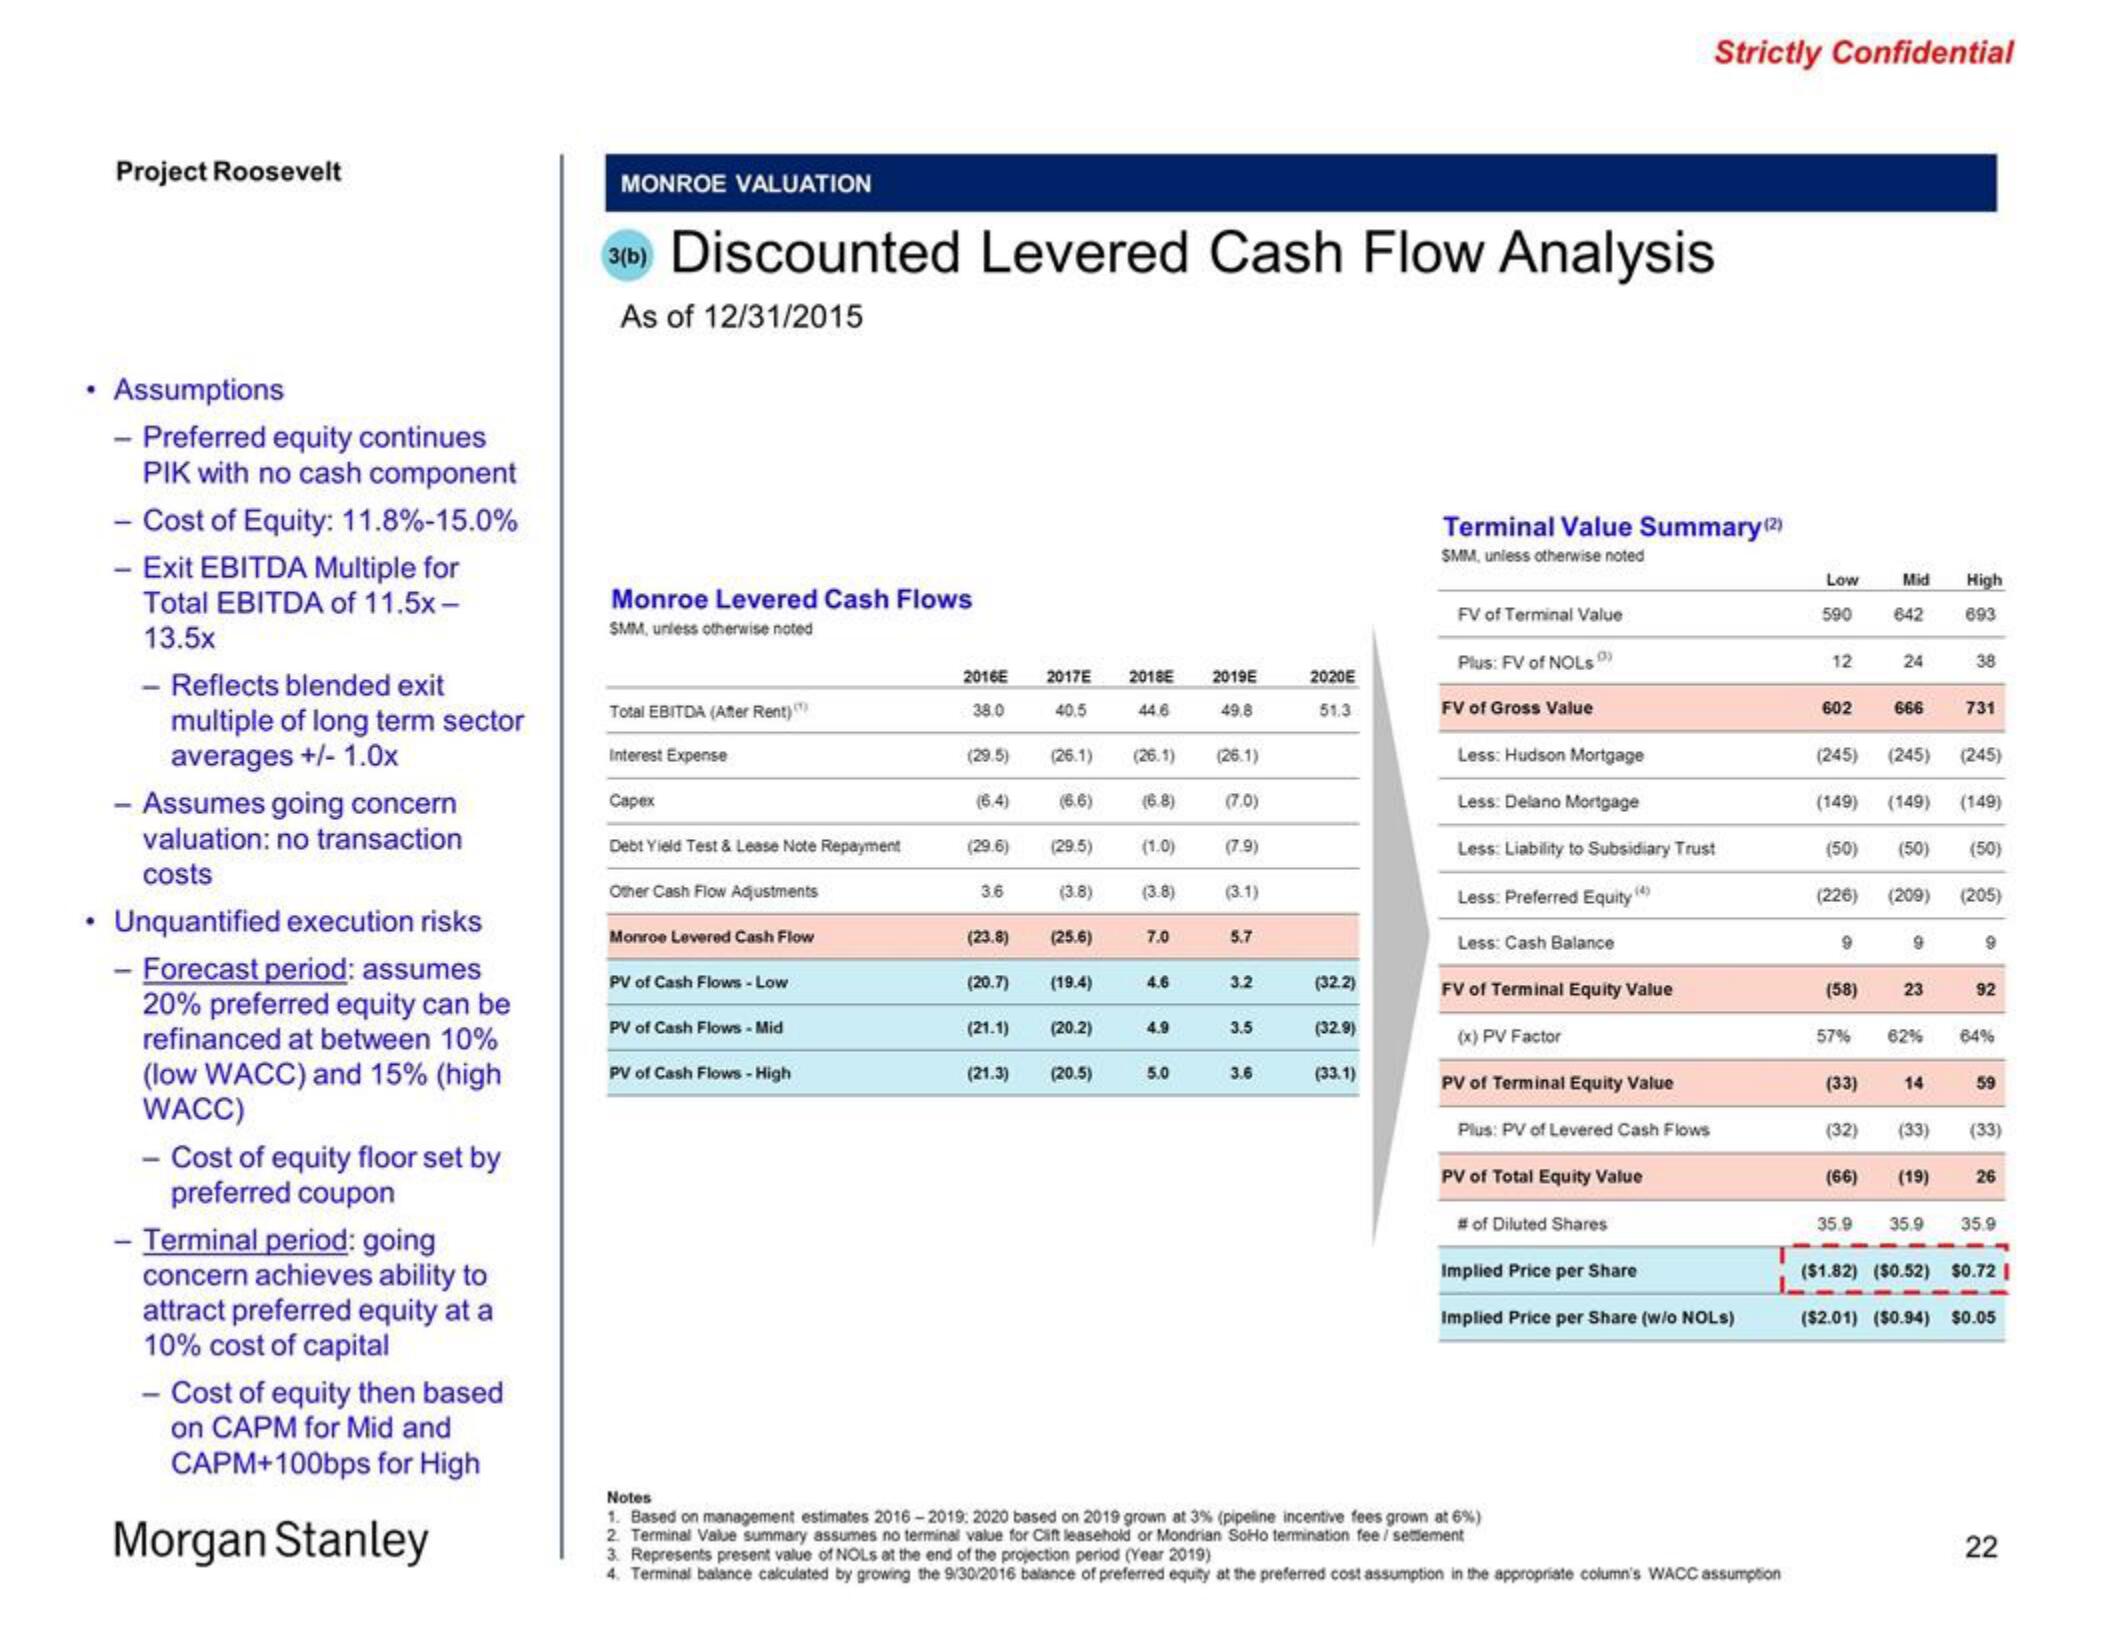
MONROE VALUATION
3(b) Discounted Levered Cash Flow Analysis
As of 12/31/2015
Monroe Levered Cash Flows
SMM, unless otherwise noted
Total EBITDA (After Rent)
Interest Expense
Capex
Debt Yield Test & Lease Note Repayment
Other Cash Flow Adjustments
Monroe Levered Cash Flow
PV of Cash Flows-Low
PV of Cash Flows - Mid
PV of Cash Flows - High
2016E
38.0
(29.5)
(6.4)
(29.6)
3.6
(23.8)
(20.7)
2017E
40.5
(21.3)
(29.5)
(26.1) (26.1)
(6.6)
(3.8)
(25.6)
(19.4)
(21.1) (20.2)
2018E
(20.5)
44.6
(6.8)
(1.0)
(3.8)
7.0
4.6
4.9
5.0
2019E
49.8
(26.1)
(7.0)
(7.9)
(3.1)
5.7
3.2
3.5
3.6
2020E
51.3
(32.2)
(32.9)
(33.1)
Strictly Confidential
Terminal Value Summary (2²)
SMM, unless otherwise noted
FV of Terminal Value
Plus: FV of NOLs)
FV of Gross Value
Less: Hudson Mortgage
Less: Delano Mortgage
Less: Liability to Subsidiary Trust
Less: Preferred Equity (4)
Less: Cash Balance
FV of Terminal Equity Value
(x) PV Factor
PV of Terminal Equity Value
Plus: PV of Levered Cash Flows
PV of Total Equity Value
# of Diluted Shares
Implied Price per Share
Implied Price per Share (w/o NOLs)
Notes
1. Based on management estimates 2016-2019 2020 based on 2019 grown at 3% (pipeline incentive fees grown at 6%)
2. Terminal Value summary assumes no terminal value for Cift leasehold or Mondrian SoHo termination fee /settlement
3. Represents present value of NOLS at the end of the projection period (Year 2019)
4. Terminal balance calculated by growing the 9/30/2016 balance of preferred equity at the preferred cost assumption in the appropriate column's WACC assumption
Low
590
12
602
(245)
9
(58)
57%
(33)
(149) (149)
(50) (50)
(226)
(209)
(32)
Mid
(66)
35.9
642
24
666
(245)
9
23
62%
14
(33)
(19)
High
693
35.9
38
731
(245)
(149)
(50)
(205)
9
92
64%
59
(33)
26
35.9
($1.82) ($0.52) $0.72 |
($2.01) ($0.94) $0.05
22View entire presentation