Crocs Results Presentation Deck
cr
CS
cr
OCS
CI
OC
FINANCIAL OUTLOOK
2022E GUIDANCE
(numbers on reported basis, unless otherwise noted)
Total Revenues
crocs™
HEY
DUDE
GOOD TO GO-TO
Adjusted Operating Margin(4)
Adjusted Operating Income(4)
Adjusted One Time Costs (4)
Adjusted Tax Rate(4)
Adjusted Diluted EPS(4)
8.
Q3 2022E
$915 to $955M
$680 to $700M
+15% to 18% CC(1)
$235 to $255M
-25% to 26% (5)
~$10M(8)
FY 2022E
$3.395 to $3.505B
$2.545 to $2.615B
+14% to 17% CC (2)
$850 to $890M (3)
-26% to 27% (6,7)
-$880 to $945M(6,7)
~$130(7)
~22%
$9.50 to $10.30
Capital Expenditures
$170 to $200M
1.
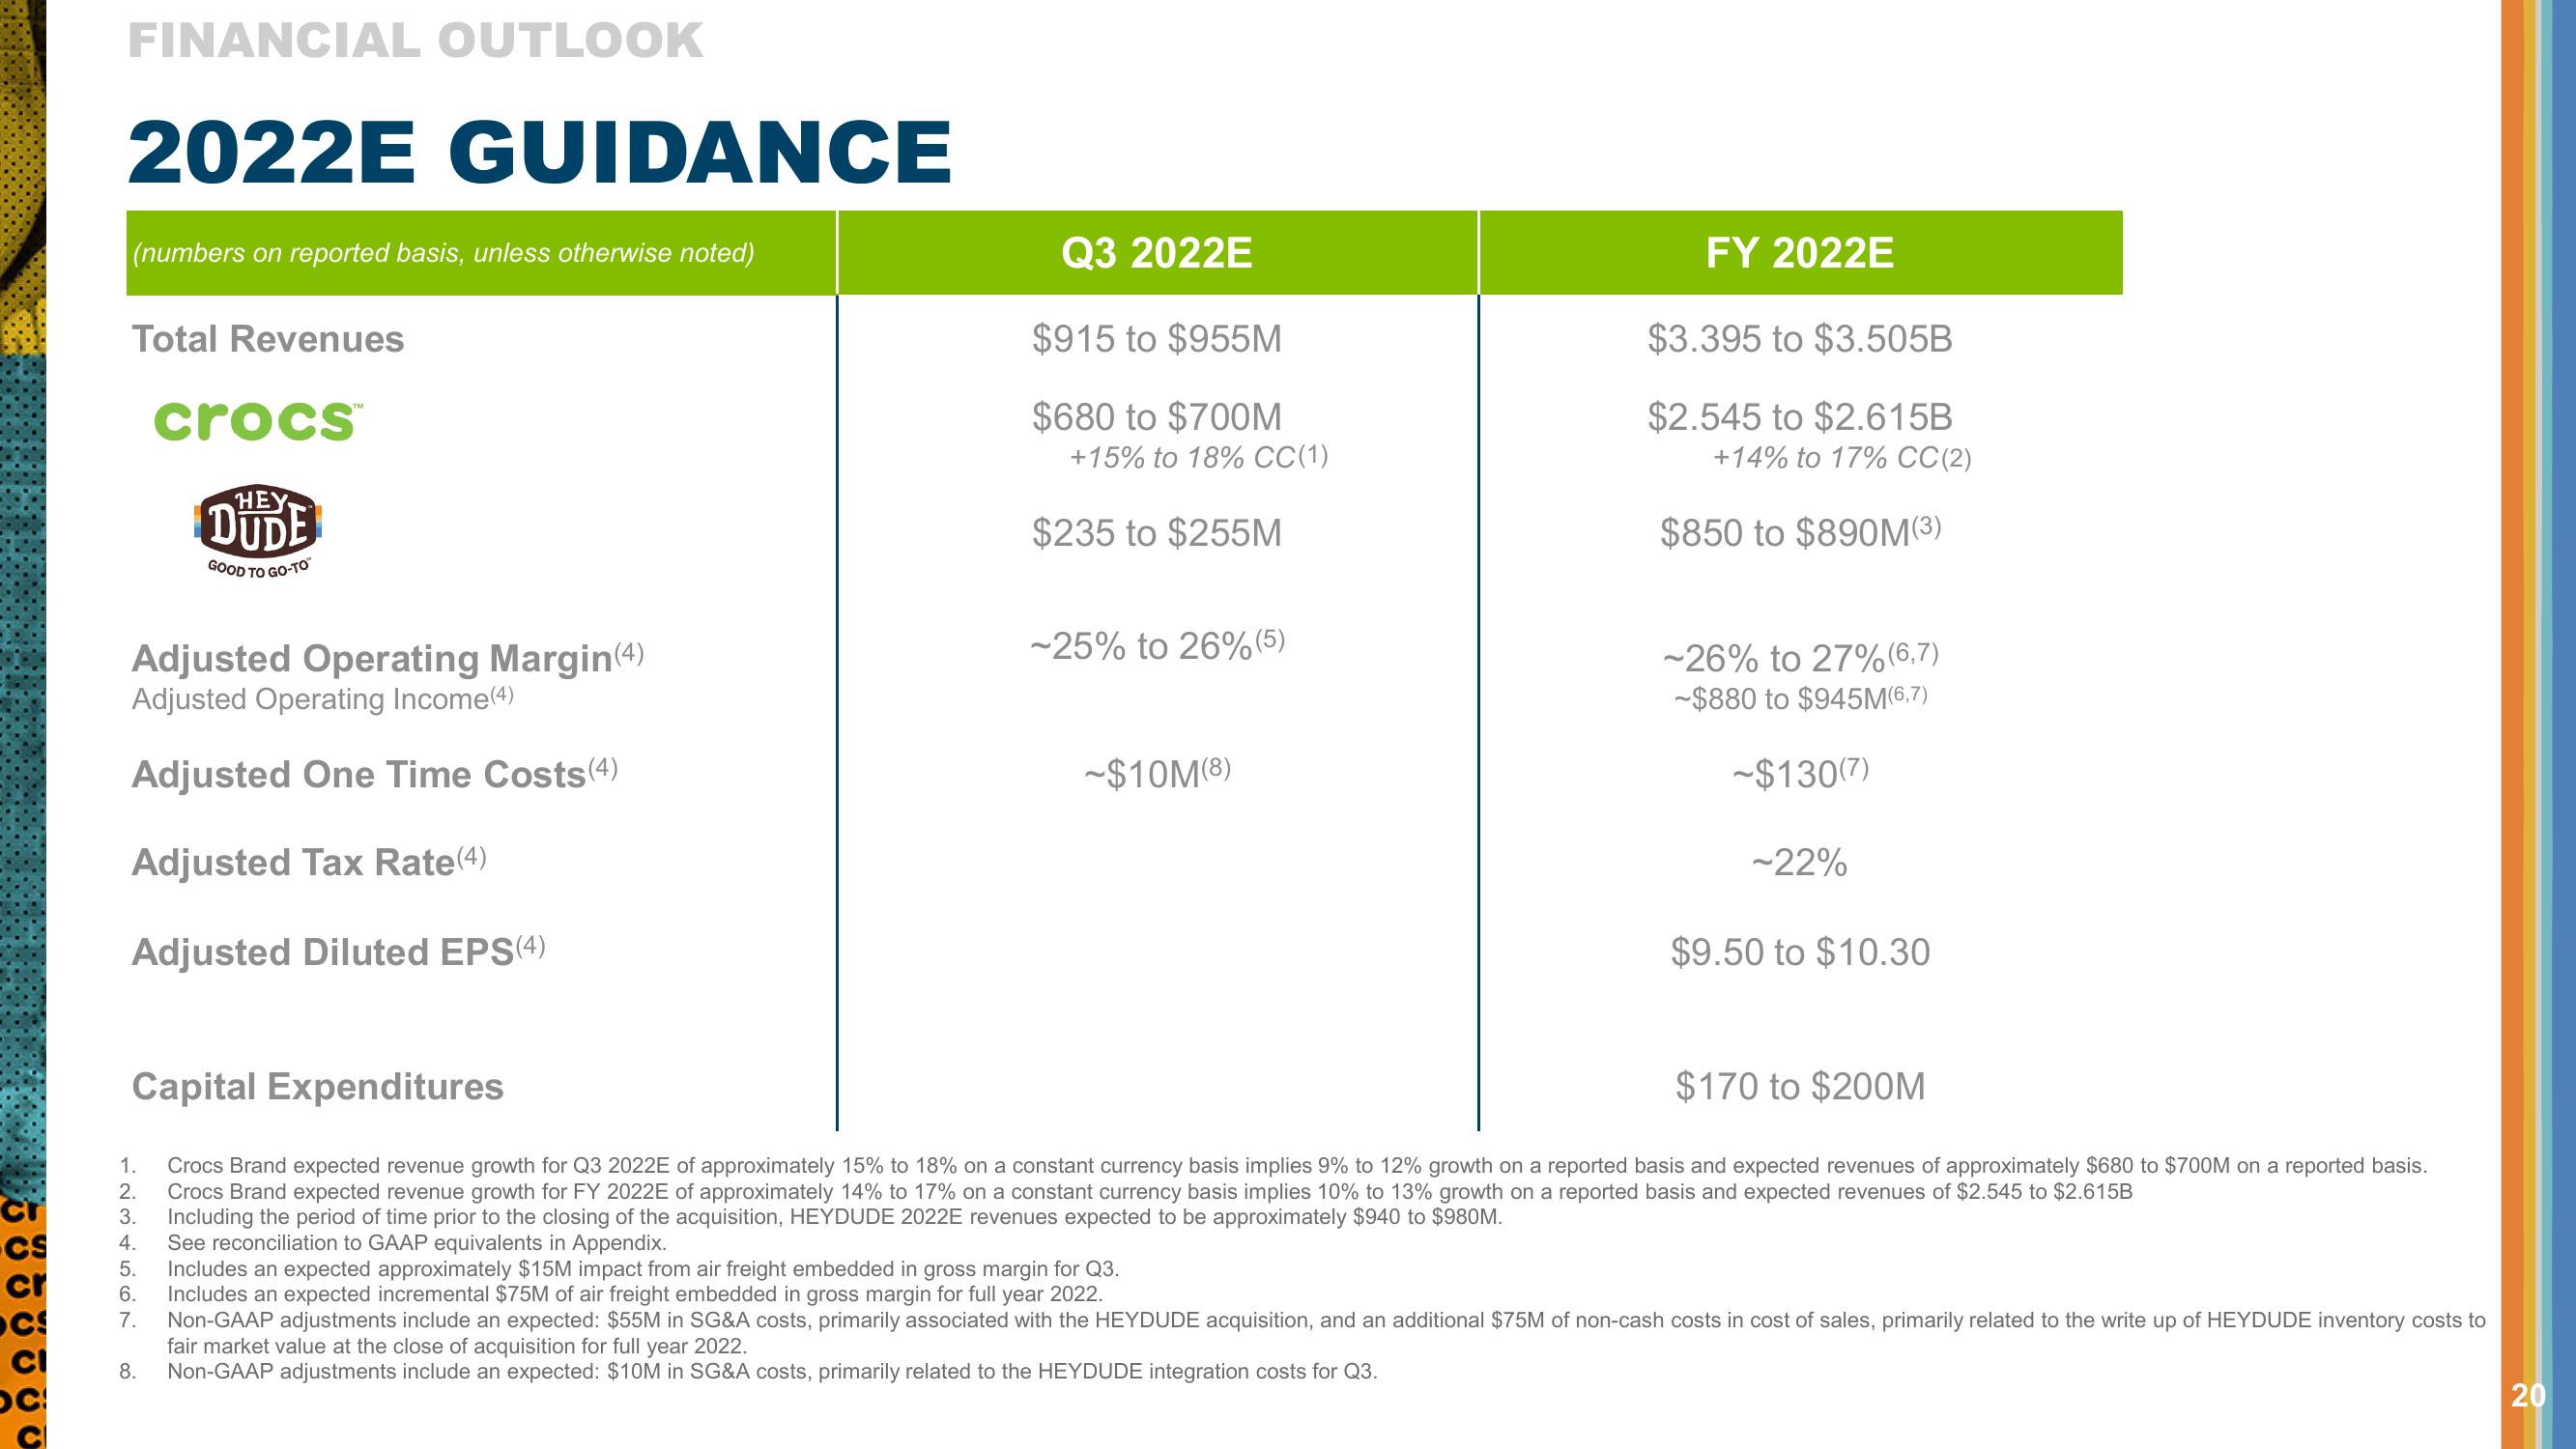
Crocs Brand expected revenue growth for Q3 2022E of approximately 15% to 18% on a constant currency basis implies 9% to 12% growth on a reported basis and expected revenues of approximately $680 to $700M on a reported basis.
2. Crocs Brand expected revenue growth for FY 2022E of approximately 14% to 17% on a constant currency basis implies 10% to 13% growth on a reported basis and expected revenues of $2.545 to $2.615B
3.
Including the period of time prior to the closing of the acquisition, HEYDUDE 2022E revenues expected to be approximately $940 to $980M.
4.
See reconciliation
GAAP equivalents in Appendix.
5.
6.
7.
Includes an expected approximately $15M impact from air freight embedded in gross margin for Q3.
Includes an expected incremental $75M of air freight embedded in gross margin for full year 2022.
Non-GAAP adjustments include an expected: $55M in SG&A costs, primarily associated with the HEYDUDE acquisition, and an additional $75M of non-cash costs in cost of sales, primarily related to the write up of HEYDUDE inventory costs to
fair market value at the close of acquisition for full year 2022.
Non-GAAP adjustments include an expected: $10M in SG&A costs, primarily related to the HEYDUDE integration costs for Q3.
20View entire presentation